4 Results of survey of businesses
This chapter details the key findings from the survey of businesses with sections describing the profile of businesses responding to the survey, challenges faced in running the business, contracts, pay, hours and benefits, training and development, employee voice, and grievances and discipline.
4.1 Profile of businesses
Overall, 79 hospitality businesses responded to the survey. The following sections provide details on the profile of these businesses including business type, size and location.
As explained in Chapter 2, the sample sizes are too small to report comparisons between individual types of businesses at a statistically significant level.
4.1.1 Nature of business
As shown in Figure 20, a broad mix of types of hospitality business took part in the survey. 44% were hotels (including all star gradings), 23% were restaurants and 19% were pubs.
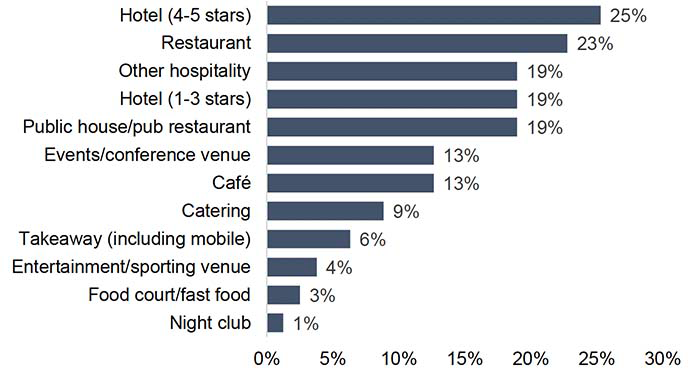
Base: All businesses (n=79). Multiple responses could be provided so results total more than 100%. Q1 Which of the following best represents the nature of your business?
Comparing the sample profile with data on the profile of all hospitality businesses in Scotland (see Table 4) illustrates an under-representation of takeaways, while coverage of hotels was higher in the survey sample. The representation of other types of businesses in the survey largely reflected their proportions in the wider sector.
| Survey of businesses sample profile | Proportion of hospitality businesses in Scotland* | |
|---|---|---|
| Hotels | 44% | 12% |
| Restaurants and cafés | 34% | 35% |
| Takeaways | 6% | 29% |
| Pubs and bars | 19% | 16% |
| Licenced clubs | 1% | 3% |
*Source: ONS Businesses – Inter-Departmental Business Register 2023
4.1.2 Size of business and ownership
62% of businesses that took part in the survey employed less than 50 staff, 25% employed between 50 and 249 staff and 13% employed 250 or more staff.
By comparison, Scottish Government data indicates that a much larger percentage of all businesses in the sector (97%) have fewer than 50 employees, while 2% have between 50-249 employees and 1% employ 250 or more (Source: Businesses in Scotland, Scottish Government, 2023. Note: proportions for registered private sector businesses only and use rounded number of businesses ).
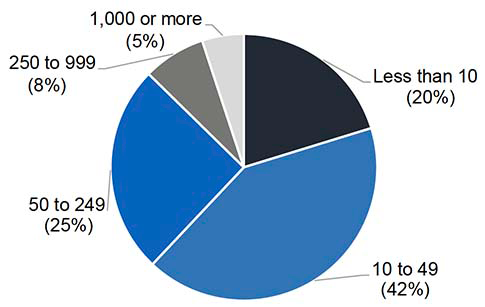
Base: All businesses (n=79) Q6 Approximately how many staff does your business currently employ?
As shown in Figure 22, the sample also contained a mix of independent hospitality businesses and businesses which were part of a small or large chain.
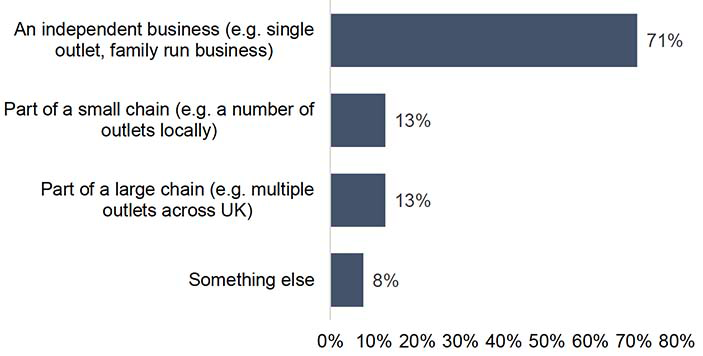
Base: All businesses (n=79) Multiple responses could be provided so results total more than 100%. Q4 Which of the following best describes your business?
Also, 80% of the businesses taking part in the survey stated that they were operating in the private sector, 8% were in the third sector, 6% were in the public sector and 6% stated that their business was in a different sector or that they didn’t know.
4.1.3 Location of business
Responding businesses were asked to indicate where their business operated. More than one option could be selected as some operated multiple premises/outlets.
Overall, the 79 participating businesses had premises in 26 of Scotland’s 32 local authority areas with the largest percentages operating premises in Edinburgh (32%), Glasgow (14%), the Highlands (11%) and Aberdeen (9%).
Also, the businesses operated in a mix of urban and rural locations including 20% in areas they classified as remote rural or island.
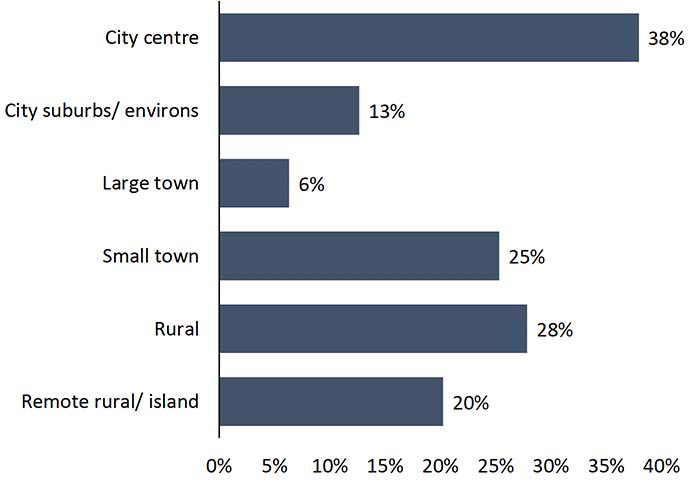
Base: All businesses (n=79) Multiple responses could be provided so results total more than 100%. Q5 In which of the following types of location is your business based?
4.2 Contracts
Businesses were asked to specify the types of contractual arrangements in place in their organisation. As shown in Figure 24, many businesses are using a variety of types of contract, 90% indicated that they had permanent/ open ended contracts in place, while 39% used fixed term contracts and 37% used zero-hour contracts.
Overall, 25% used agency workers but this increased to 49% amongst hotels.
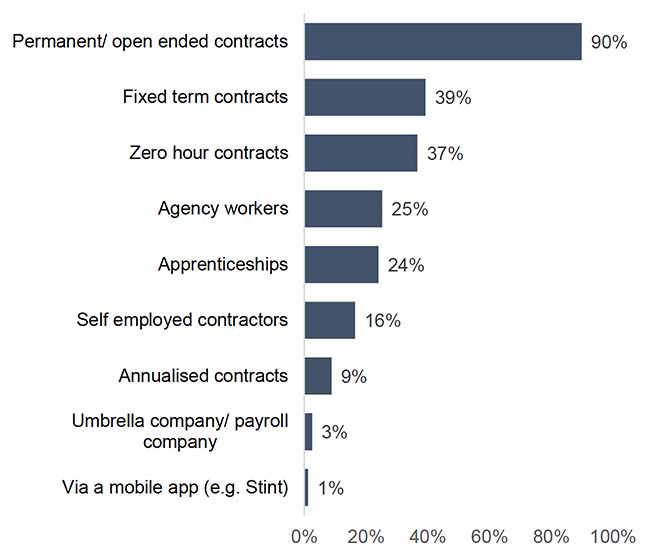
Base: All businesses (n=79) Multiple responses could be provided so results total more than 100%. Q12 What type(s) of contractual arrangements are used at your organisation?
4.3 Challenges faced
Respondents were presented with the list of potential challenges shown in Figure 25 and asked to what extent, if any, each of these were problems for their businesses.
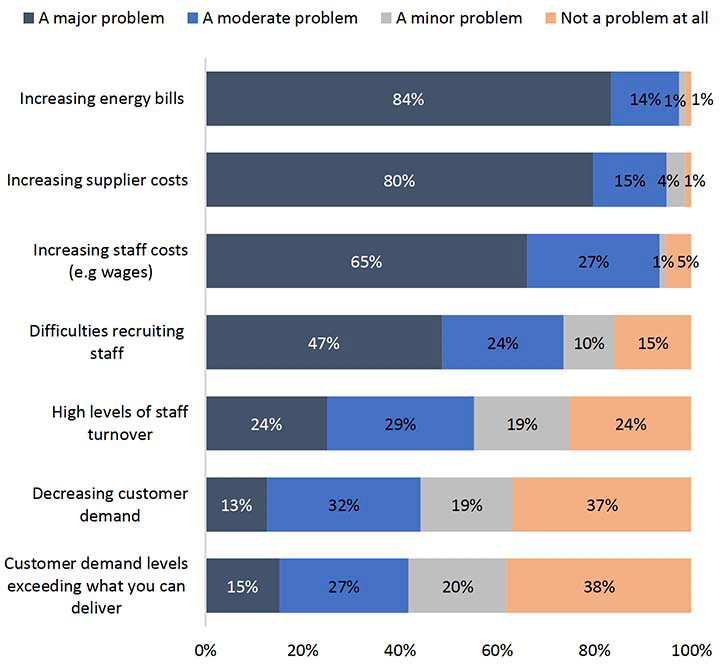
Base: All businesses (n=79) Q7 - To what extent, if any, is your business experiencing any of the following problems?
The most significant issues rated as “a major problem” or “a moderate problem” by the vast majority of businesses were increasing energy bills (98%), increasing supplier costs (95%) and increasing staff costs (92%).
4.2.1 Details and impacts of recruitment challenges
The 71% of businesses that indicated they were experiencing problems with staff recruitment were asked a series of further questions regarding these difficulties.
As shown in Figure 26, the roles which businesses were most often finding difficult to recruit were in the kitchen, in particular chefs, but also other kitchen staff and kitchen porters. However, a wide range of other front and back of house roles were also frequently identified as difficult to recruit.
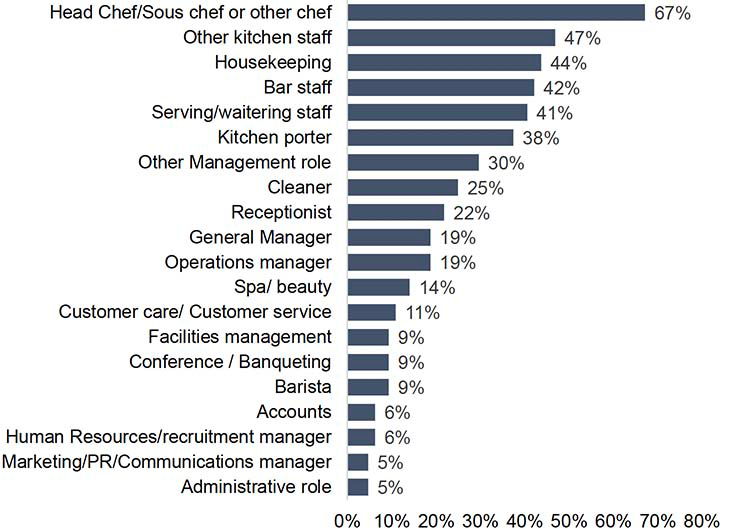
Base: Businesses experiencing recruitment challenges (n=64) Multiple responses could be provided so results total more than 100%. Q9 Which roles are you finding it difficult to recruit?
Asked for their opinions on the factors contributing towards their recruitment problems (Figure 27), the options selected by over half of businesses were the general lack of appeal of working in the sector, a lack of enough or suitably skilled people to employ and issues relating to the UK leaving the EU.
Responses varied by location with businesses based in rural and remote rural areas more likely to state that staff being unable to find accommodation or housing and transport issues were contributing towards problems recruiting staff (73% and 67% respectively).
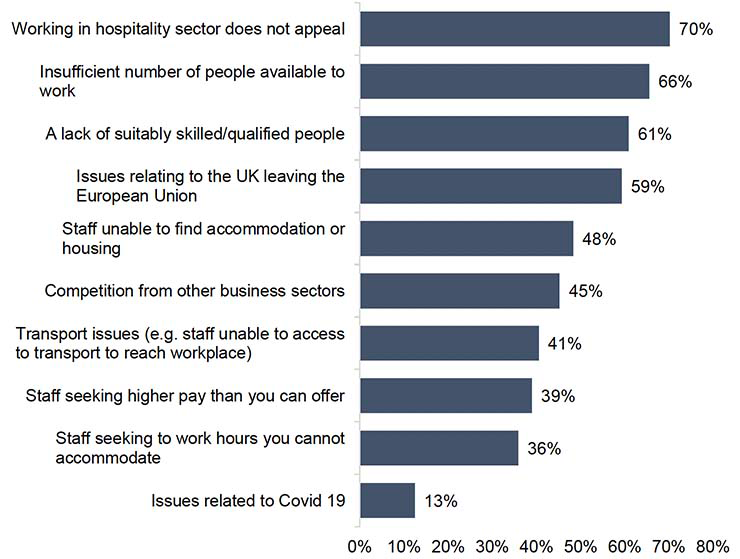
Base: Businesses experiencing recruitment challenges (n=64) Multiple responses could be provided so results total more than 100%. Q10 Which of the following factors, if any, have contributed to your problems recruiting staff?
Recruitment challenges caused knock-on problems for many businesses. For instance, as shown in Figure 28, 67% of businesses stated that existing staff were required to work longer hours.
Other common ‘knock on’ impacts included the need to change what was offered to customers, a negative impact on the quality of customer experience, reducing opening hours and having to cancel or postpone plans to improve the business.
Responses varied by business location with those based in rural or remote rural locations more likely to state that staff shortages were contributing towards the increased cost of staff accommodation (33%).
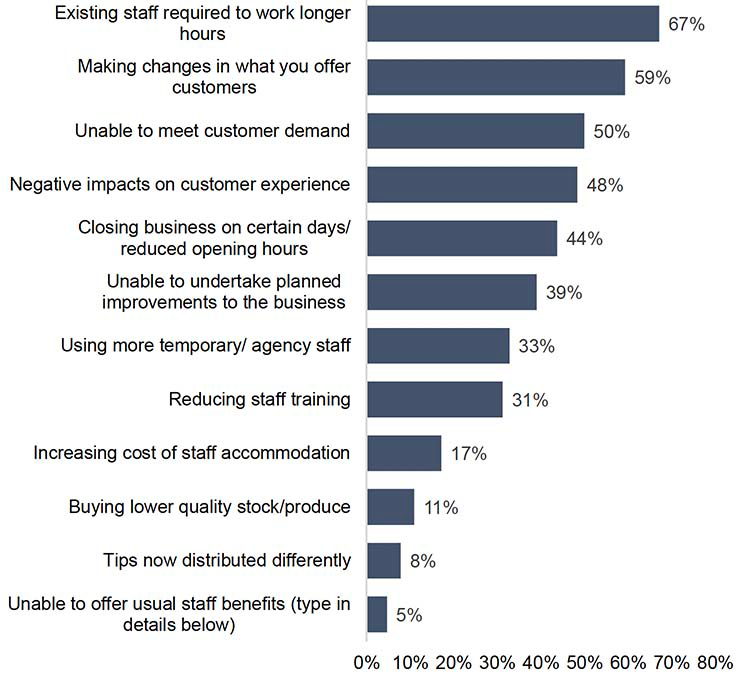
Base: Businesses experiencing recruitment challenges (n=64) Multiple responses could be provided so results total more than 100%. Q11 How are staff shortages affecting your business?
4.4 Pay
The Fair Work Convention’s Fair Work Framework calls for all workers to be paid at least the Real Living Wage. 44% of businesses taking part in the survey stated they were accredited Real Living Wage employers, and 71% stated that everyone working in business was paid the Real Living Wage or more.
However, 29% of businesses stated that some staff were currently not paid at this level.
When asked why this was the case, responses largely related to the costs of paying at this level not being affordable to the business in the face of rising costs (mentioned by 9 of 18 businesses responding), or that staff were aged under 18 (mentioned by 6 of 18 businesses responding).
Responses included the following:
“Affordability and lack of employee experience.”
“Customers cannot accept increased prices.”
“Have not had the opportunity to address this due to all our other costs rising.”
“Our industry runs on a net profit margin of 5-6%. To pay the real living wage will cost us £45,000 per year. That’s more than we have in profit.”
“Variations in age, skill & performance levels and the variety of jobs all play a factor.”
“We have staff under 18 that cannot legally carry out all tasks required. Soaring costs. Focusing on survival.”
4.5 Hours and benefits
78% of businesses offered one or more of the flexible working arrangements shown in Figure 29 to workers below senior manager grades. The most prevalent form of flexibility offered was flexible working hours (65%), while smaller percentages offered the other arrangements such as term-time working (25%), homeworking (25%), condensed hours (25%) or job sharing (14%).
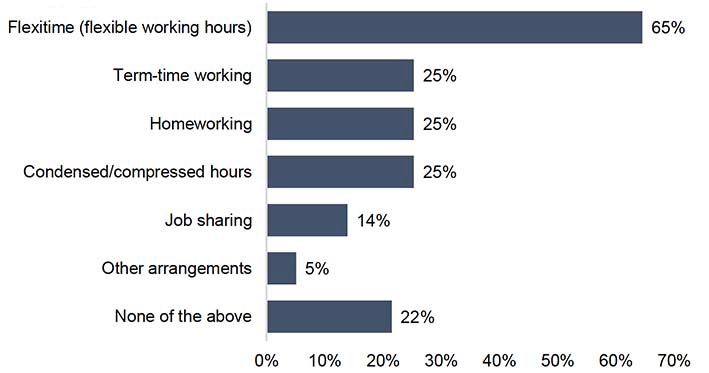
Base: All businesses (n=79) Multiple responses could be provided so results total more than 100%. Q16 Thinking of workers below senior manager grades, which of the following flexible working arrangements, if any, are available?
As shown in Figure 30 overleaf, businesses were also asked to specify which non-pay terms and conditions were offered to their staff.
While the most commonly offered benefit was employer contributions to a pension scheme, offered by 78% of responding businesses, this benefit is a statutory requirement so it is notable that 22% of those responding did not select this option.
The other options selected by the majority of businesses were discounts for workers and their friends/ family (76%) and subsidised meals (62%). However, fewer offered any other benefits - just under a quarter offered maternity leave in excess of statutory requirements (23%) and around half this proportion offered paternity leave in excess of statutory requirements (13%). Also, 20% offered free transport to staff after late shifts.
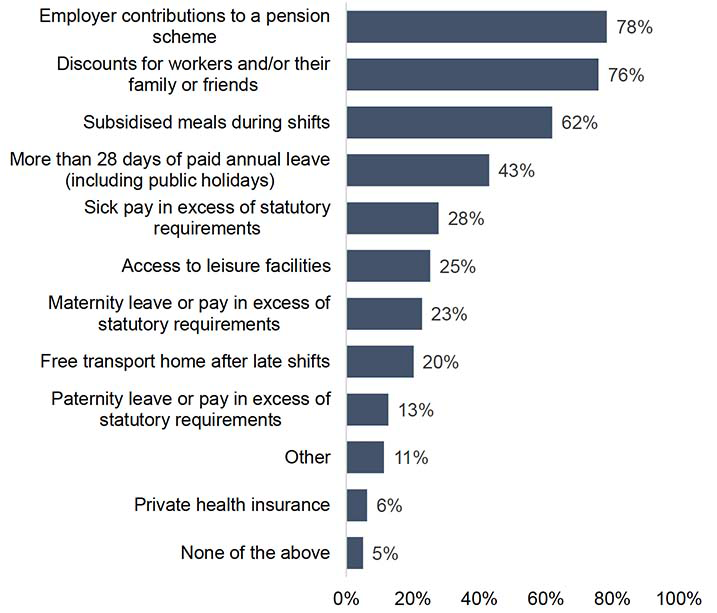
Base: All businesses (n=79) Multiple responses could be provided so results total more than 100%. Q17 Thinking of workers below senior manager grades, are workers entitled to any of these non-pay terms and conditions?
4.6 Training and development
4.6.1 Delivery of training
As shown in Figure 31, the majority of businesses deliver on the job training (94%) and induction training for new staff (85%) and almost 3 in 4 deliver training via online courses (72%).
While 65% of businesses stated that off the job training was delivered in house, almost as many (57%) used third/ external parties. 44% delivered a mix of both in house and third party off the job training.
Comparing results by business type, while 15% of businesses did not offer induction training for new staff, this increased to 38% amongst those businesses with fewer than 10 staff.
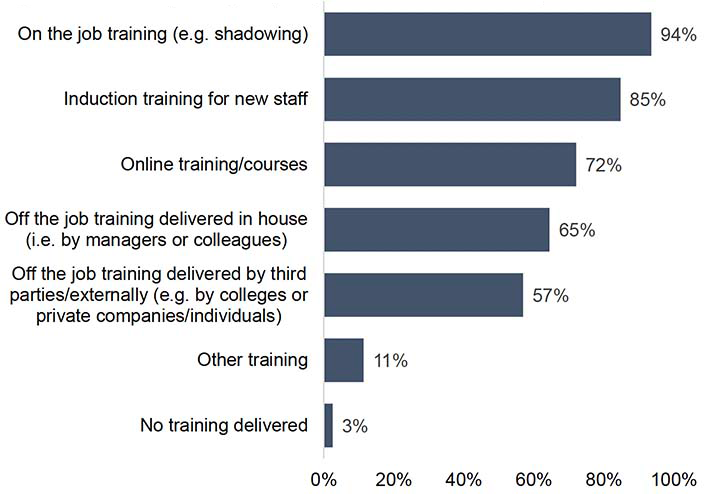
Base: All businesses (n=79) Multiple responses could be provided so results total more than 100%. Q18 In which of the following ways do you deliver training to your workforce/ management?
53% of businesses taking part in the survey stated that they had a budget for training beyond mandatory training, such as health and safety. This was more likely to be the case amongst hotels, but less likely amongst pubs and bars (69% and 33% respectively). 4.6.2 Future training plans
52% of businesses expected the amount of training they arranged or funded for staff during the next 12 months to remain the same as during the last 12 months, 34% expected this to increase, while 11% expected this to decrease.
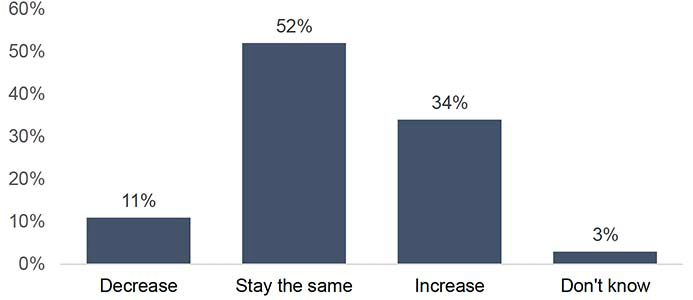
Base: All businesses (n=79) Q20 Do you expect the amount of training you arrange or fund for staff to increase or decrease over the next 12 months?
4.6.3 Challenges faced when delivering training
Businesses were asked to rate their experiences in relation to delivering training and retaining skills.
As shown in Figure 33 overleaf, 57% rated ‘accessing specific funding to support training and upskilling’ as either very difficult or difficult, while 50% rated ‘providing staff with paid time off to undertake training’ as very difficult or difficult and 51% rated ‘finding training solutions within your budget/ affordable for your business’ as either very difficult or difficult.
‘Retaining skills within your business’ was also rated as very difficult or difficult by 47% of businesses.
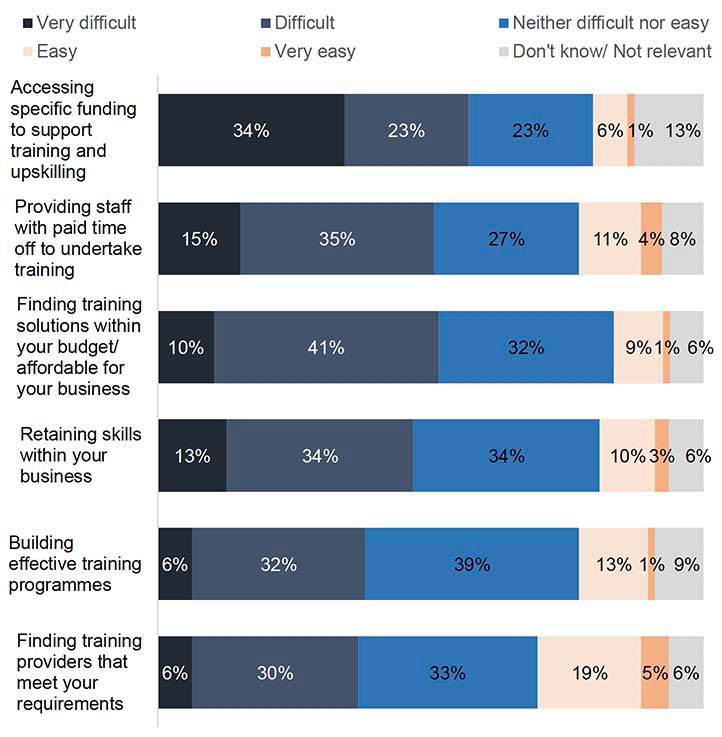
Base: All businesses (n=79) Q21 In general, how easy or difficult are the following for your business when it comes to delivering training?
Asked to provide more details, businesses provided comments further illustrating the challenges of staff shortages and funding when organising training. A selection of the comments provided are as follows:
“Because of staff shortages we cannot offer the same amount of training as we used to. We’ve also had to stop offering additional training outside our business, courses and hospitality related scholarships are off the table just now as we have no time or money.”
“Getting staff the time off to attend training. Already short staffed so hard to find time.”
“Staff needed on floor and added cost of paying staff overtime and training costs. We have a vision to deliver but it is challenging.”
“Workforce development fund being slashed hasn’t helped. Also, as this fund is/was available, training providers have been known to increase prices.”
4.7 Employee voice
4.7.1 Staff meetings and influence on decisions
56% of businesses responding to the survey have a staff association or dedicated staff network(s) that support staff to have a say in their working conditions.
As shown below, when asked whether they hold meetings where staff can express their views and influence the outcome of particular issues, most businesses regularly or occasionally held meetings relating to health and safety issues and working hours/rotas.
In contrast, meetings were less likely to be held regarding training plans, with just a third of businesses meeting about this on a regular basis.
Consulting staff on health and safety is a requirement of the Health and Safety at Work Act, so it is notable that 6% of businesses stated that they never hold staff meetings on this topic.
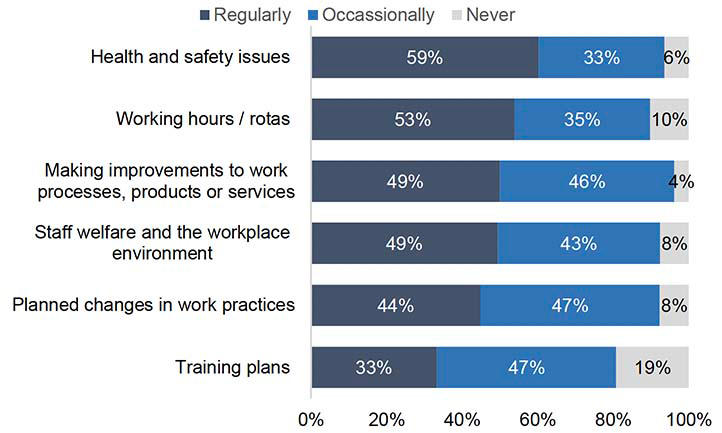
Base: All businesses (n=79) Q27 Do you hold meetings where staff can express their views and influence the outcome of the following issues?
Businesses were also asked how influential staff could be on management’s decisions at meetings. Most businesses stated that staff could have an influence with 39% indicating that staff could be ‘very influential’ while 56% stated that they could be ‘fairly influential’.
4.7.2 Relationships with trade unions
10% of businesses taking part in the survey stated that they consult with trade unions to enable staff to have a voice in their working conditions. This was more likely to be the case amongst larger businesses employing 50 or more staff (20% consulted with trade unions).
Similarly, when asked if they have a regular working relationship with any trade unions, the majority stated that they didn’t (91%), while 3% had a recognition agreement with trade unions recognised to negotiate on behalf of their members, and 5% stated that unions met regularly with staff but there was no recognition agreement.
All businesses were asked if they were interested in having closer working relationships with trade unions. As shown below, 15% stated that they were ‘definitely’ or ‘possibly’ interested, while 63% were probably or definitely not interested.
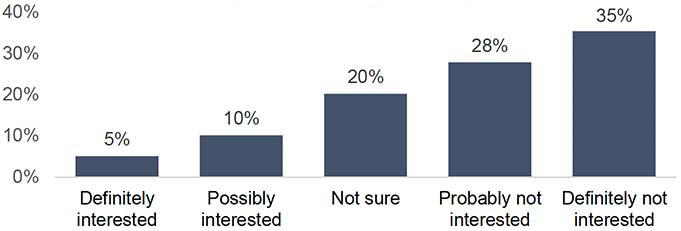
Base: All businesses (n=79) Q25 Would your business be interested in having a closer working relationship with trade unions?
4.8 Grievances and disciplinary procedures
4.8.1 Grievances
By law, all businesses must have a grievance procedure and share it with staff. As such, it is interesting to note that only 89% of business taking part in the survey reported having a formal procedure for dealing with individual grievances raised by employees. 9% stated that they did not have a formal procedure and 3% didn’t know.
As shown overleaf, the most common types of grievance dealt with in the last year related to pay, terms and conditions (14%), unfair treatment and relations with managers (13%) and bullying/ harassment at work (11%). 54% stated that no grievances had been raised in the last year.
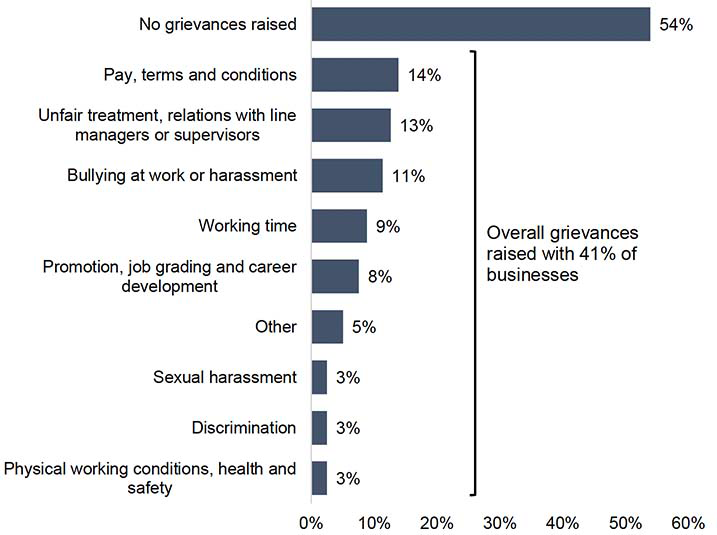
Base: All businesses (n=79) Multiple responses could be provided so results total more than 100%.
Q30 Which of the following types of grievances, if any, have been raised in the past year whether through a procedure or not?
4.8.2 Discipline and dismissals
91% of participating businesses have a formal procedure for dealing with discipline and dismissals other than redundancies.
38% stated that disciplinary action had been taken in their workplace in the past year. This ranged from 6% of businesses with less than 10 employees to 80% of those with 250 or more employees.
As shown in Figure 37, amongst these businesses the most common reasons for taking disciplinary actions were poor performance (47%) and poor timekeeping/ unauthorised absence (40%).
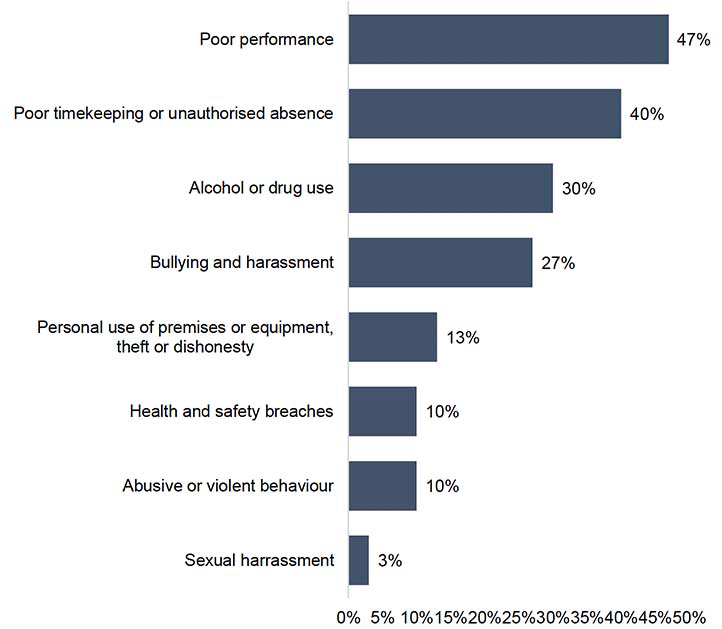
Base: Businesses which have taken any disciplinary action in the past year (n=30) Multiple responses could be provided Q32 What were the reasons for taking disciplinary action in the past year?
4.9 Overall views on working in hospitality
4.9.1 Is your business a good business to work for?
97% of businesses taking part in the survey believed that, all things considered, their business was a good business to work for.
When asked to explain their answer some of the responses provided included the following:
“Excellent retention rates, great team spirit/atmosphere, great customer feedback re customer service. Our employees tell us that in review sessions and open staff meetings.”
“Family business served the community and its people for 50 years. Lots of customers children work for us. We have had staff spanning 3 generations. This is our barometer for how well we are doing. Our people support us.”
“We understand that our people are the key to the success of our business. Therefore, we do all we can to look after our team in the best way we can. Our number one business objective is to be one of Scotland’s best employers and an exemplar for Fair Work in Hospitality.”
“We are all hard working, and team players who never want to see staff struggle always looking for best possible outcome for the staff to try and keep business afloat.”
“We are a better business than we have ever been. We listen and we act. There are huge financial challenges that we are still working through and team requests don’t take account of the other pressures facing the business. It’s a hard act to juggle. But without our team we don’t have a business.”
4.9.2 How hospitality employers can make the sector a more attractive career choice
A further open question invited businesses to provide their views on how to make the sector more attractive.
As shown below, the most common responses related to increasing pay, providing more flexibility in hours/rotas and listening/ communicating better with staff.
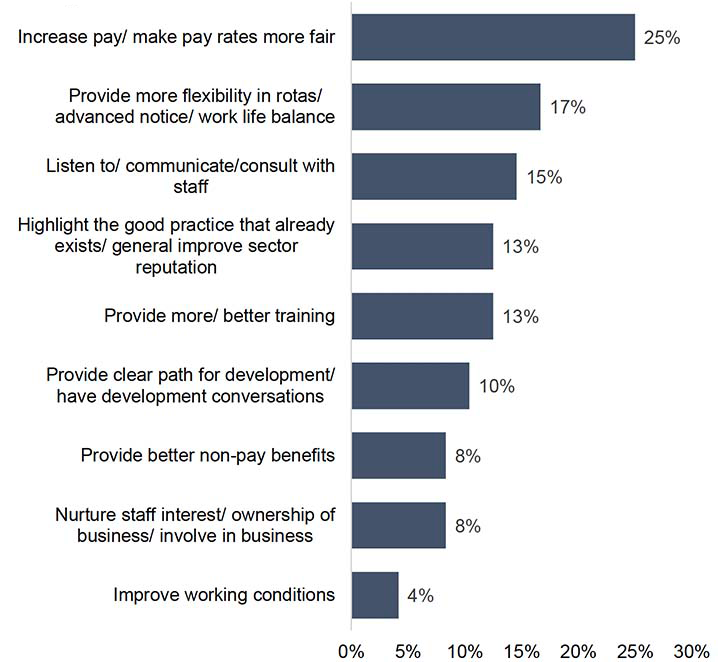
Base: All businesses providing a response (n=48) Note: Question was asked in an open-ended format with responses then categorised into the above common themes. A single respondent may have referenced multiple themes. Q35 What do you think hospitality employers can do to improve working relationships and make the industry a more attractive career choice for employees?
Some of the detailed comments provided by businesses are included below:
“Actively listen to staff and respond to ideas and suggestions. Pay a minimum of the Living Wage. Ensure working conditions are as good as you can make them. Ensure that staff know they’re valued; that all jobs within the business are essential and make sure that any interpersonal staff issues are dealt with, and don’t sour the atmosphere. Having hospitality as an active career choice is a difficult goal, because the industry has a bad reputation for long/unsocial hours, bullying, low pay.”
“Allow more money generated by the business to come back to the business for trading improvements etc. Cut VAT to 10% as in Europe and 10% of turnover would be available to invest.”
“Be open to staff input, be open to more formal discussion and negotiation on working conditions, find ways to support professional development opportunities (lobby government to support funded opportunities).”
“Better pay, benefits and access to training, however rising costs are extremely prohibitive of this.”
“Involve team members in the business, encourage them to take ownership of the area they work in. Make sure that development conversations lead to outcomes from activity. Work in partnership with schools, apprentices and colleges. Work on parents and teachers to change their perception of the industry into a first choice career, recognising the varied skills the industry represents - engineering, finance, sales & marketing, entrepreneurship, HR - not just cooking, serving and cleaning. It’s a great place to work, an opportunity to grow interpersonal skills that last a lifetime.”
“Need to improve working hours in relation to a balanced work-life approach rather than working every weekend type environments.”
“Problems start with colleges giving unrealistic idea of working in hospitality. Also, we are taxed to the hilt leaving no reserves to reward great staff in order to keep them.”
“Stop expecting employees to work long hours, it’s not sustainable for the employee nor good for customer service. Look at fixed days off with 2 days off together.”
“We have no profits to pay for anything. Reduce our NDR’s, reduce VAT and we’ll be able to offer so much more.”
“We are not very good at highlighting the good practice that already exists.”
“Be allowed the time and money to do it. Get involved. There is so much great work already being done that can be piggy backed on. Communication of what is available is key.”
4.9.3 Barriers facing hospitality employers seeking to make the industry more attractive
Businesses were also asked to provide their views on the barriers making it harder for employers to make the sector more attractive. As shown below, rising costs and financial restraints were by the far the most common themes in responses.
Other commonly mentioned barriers were the attitudes of employees, the poor reputation held by the sector and the necessity to work anti-social hours.
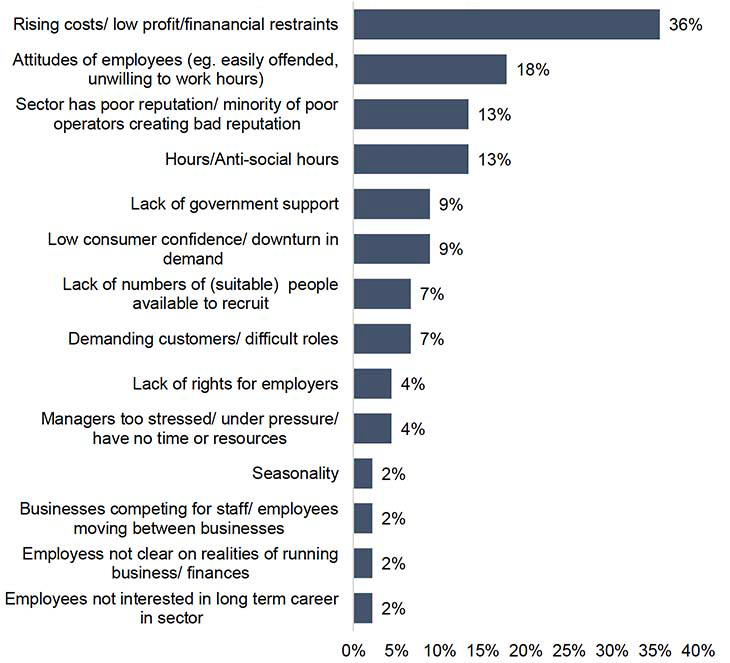
Base: All businesses providing a response (n=45) Note: Question was asked in an open-ended format with responses then categorised into the above common themes. A single respondent may have referenced multiple themes. Q36 What are the barriers facing employers to improve working relationships and make the industry a more attractive career choice?
Some of the comments provided by businesses are included below:
“Currently all the cost challenges and staff shortages are the biggest barriers.”
“Extremely high running costs mean that higher wages, incentives etc. are very difficult to build into the business.”
“Hospitality business are operational at times most people would prefer not to be in work, evenings, weekends, holidays so pay and conditions need to be the best they can be, flexibility in rotas can impact on choice of employer, self-rostering is not common. The Industry does not have the same high regard in UK as elsewhere and regarded as low skilled, that perception needs to change and that starts with employers valuing their teams and telling them so.”
“Hospitality is a hard industry for businesses to succeed in with anti-social working hours for many workers. Many external factors influence managers intentions and capacity to focus on their people.”
“I don’t know, furlough seems to have sedated the workforce and people feel they don’t need to work now or should be able to pick and choose shifts. Any industry that relies on weekend work struggles.”
“Limited cash, increased overheads all mean a squeeze on finances. Commonly terms & conditions are the only gripe - we have solved this by paying above the market rate, but still struggle to retain staff due to long hours.”
“More work is needed by all hotels to promote the industry more and get better PR for the great industry that we are.”
“Quality, health and safety and due diligence not being followed by the few, ruining it for the many, giving the sector the stigma. Those who are offering a good service and experience are not being given the credit and support.”
“Right now, income levels are difficult and this is the primary hindrance to improving staff wages. Everything in hospitality feels like a crisis, and it’s very difficult to get out of fire-fighting mode to focus on longer-term issues.”
“Staff who don’t want to work hard. Hospitality is hard and it’s difficult to recruit people who are not afraid to work hard and or see the job as beneath them.”
“Managers themselves are stressed and under pressure - they rarely have time to sit back and think about how they can develop their own teams or themselves.”