Chapter One: Fair Work Measurement Framework
In this chapter of the report, the updated Fair Work Measurement Framework is presented, with the most recent figures for indicators in the Framework in 2021 and 2022, where available,[22] and a discussion of options to address evidence gaps.
Updated indicators for each dimension are presented in Tables 1-5, along with a brief commentary on Scotland’s progress in each dimension of Fair Work. The tables include the latest values available for each indicator (2021 or 2022), and values for two benchmark years for comparisons, the year the Fair Work Measurement Framework was established (2016), and pre-pandemic levels (2019).
The tables also include additional measures for indicators identified as evidence gaps in the 2020 Fair Work report. As data for these indicators was only collected after 2020, only their 2020 and 2022 values are reported in the tables.
Opportunity
| Indicator | 2016 | 2019 | 2021 | Trend |
|---|---|---|---|---|
| Disability employment gap: Percentage point difference between employment rates of non-disabled and disabled adults | 37.4 p.p. | 32.6 p.p. | 31.2 p.p. | Improving |
| Ethnicity employment gap: Percentage point difference between employment rates of white adults and adults from minority ethnic groups | 16.3 p.p. | 16.4 p.p. | 11.7 p.p. | Improving |
| Youth unemployment rate: Proportion of 16-24 year olds who were looking for work | 11.8% | 8.3% | 10.2% | Fluctuating |
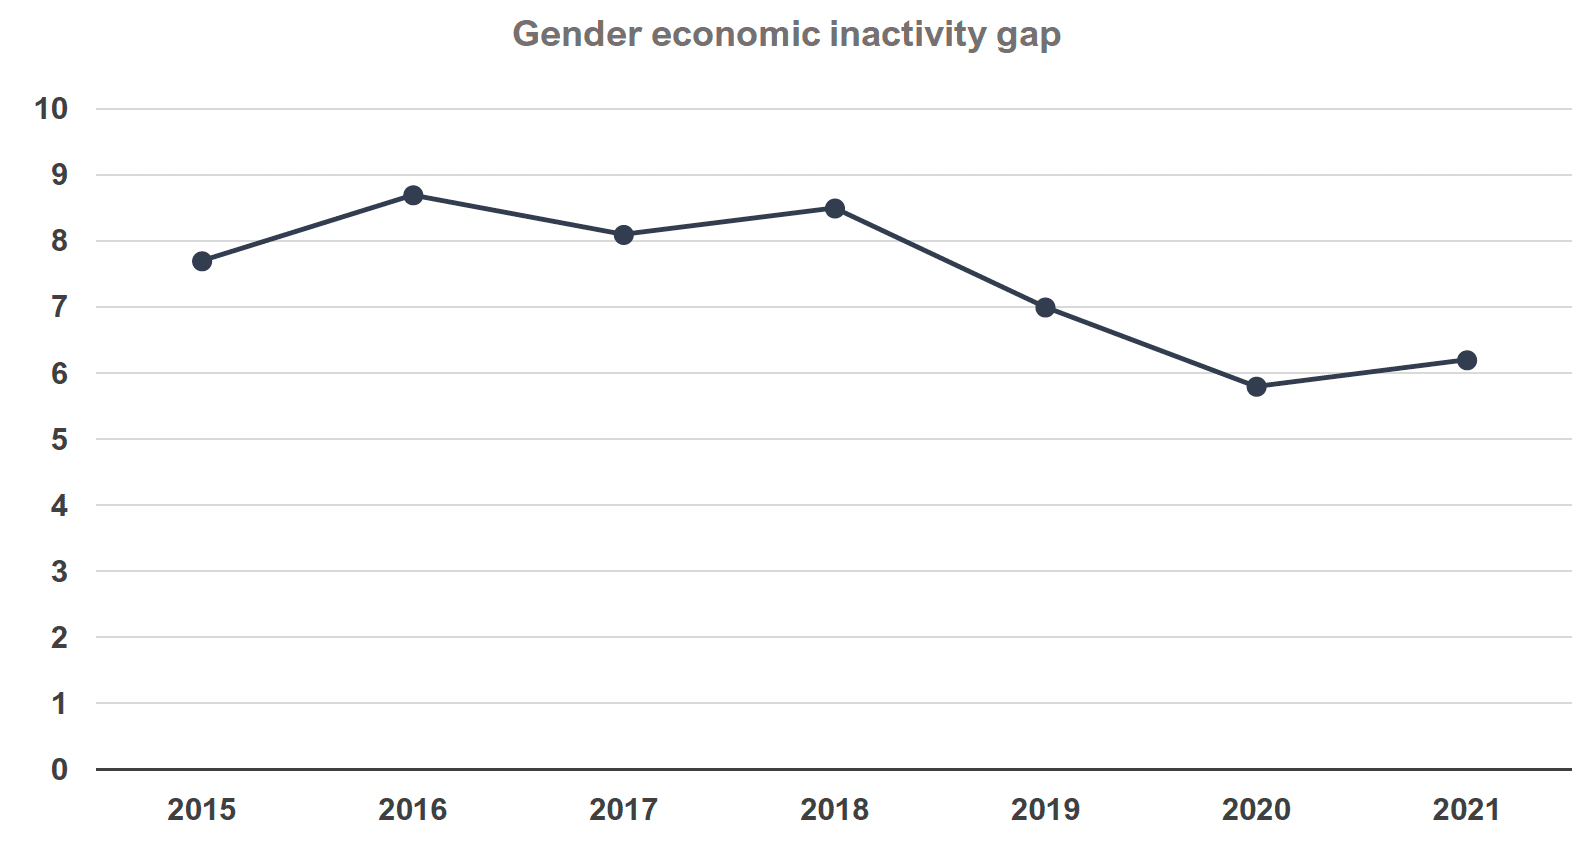
| Gender economic inactivity gap: Difference between rates of economic inactivity of men and women (16-64 years old) | 8.7 p.p. | 7.0 p.p. | 6.2 p.p. | Improving |
| Economic inactivity: Proportion of economically inactive adults who want to work | 23.8% | 20.4% | 17.5% | Improving |
| Career progression: % of workers who agree that their job offers good opportunities for career progression | N/A | N/A | 53.5% | N/A |
Source: Annual Population Survey, Quarterly Labour Force Survey.[23]
Equality of opportunity in employment has increased, with the disability and ethnicity employment rate gaps down to 31.2 percentage points in 2021 from 37.4 percentage points in 2016 and 11.7 percentage points from 16.3 percentage points respectively. The disability employment rate gap showed a consistent reduction each year between 2016 and 2021 with a slight upward fluctuation from the trend to 33.4% in 2020. On the other hand, the ethnicity employment rate gap has fluctuated significantly, as the percentage point difference between the employment rate of white adults and adults from minority ethnic groups was highest in 2018 at 19.7 and reached its most improved point in 2020 at 9.7 before climbing back to 11.7 in 2021.[24]
Similarly, the difference between men’s and women’s economic inactivity rates fell to 6.2 percentage points in 2021 compared to 8.7 percentage points in 2016. The youth unemployment rate, while higher in 2021 than in 2019, decreased overall compared to 2016 to 10.2%. Finally, the number of economically inactive adults who would like to work decreased in 2019 and 2021 compared to 2016.
Overall, the Covid-19 pandemic appears to have had a significant disruptive effect on the progress of some indicators. For example, the youth unemployment rate was up to 13.2% in 2020 compared to 8.3% in 2019.[25]
Source: Annual Population Survey
Vertical and horizontal occupation segregation
Source: Annual Population Survey
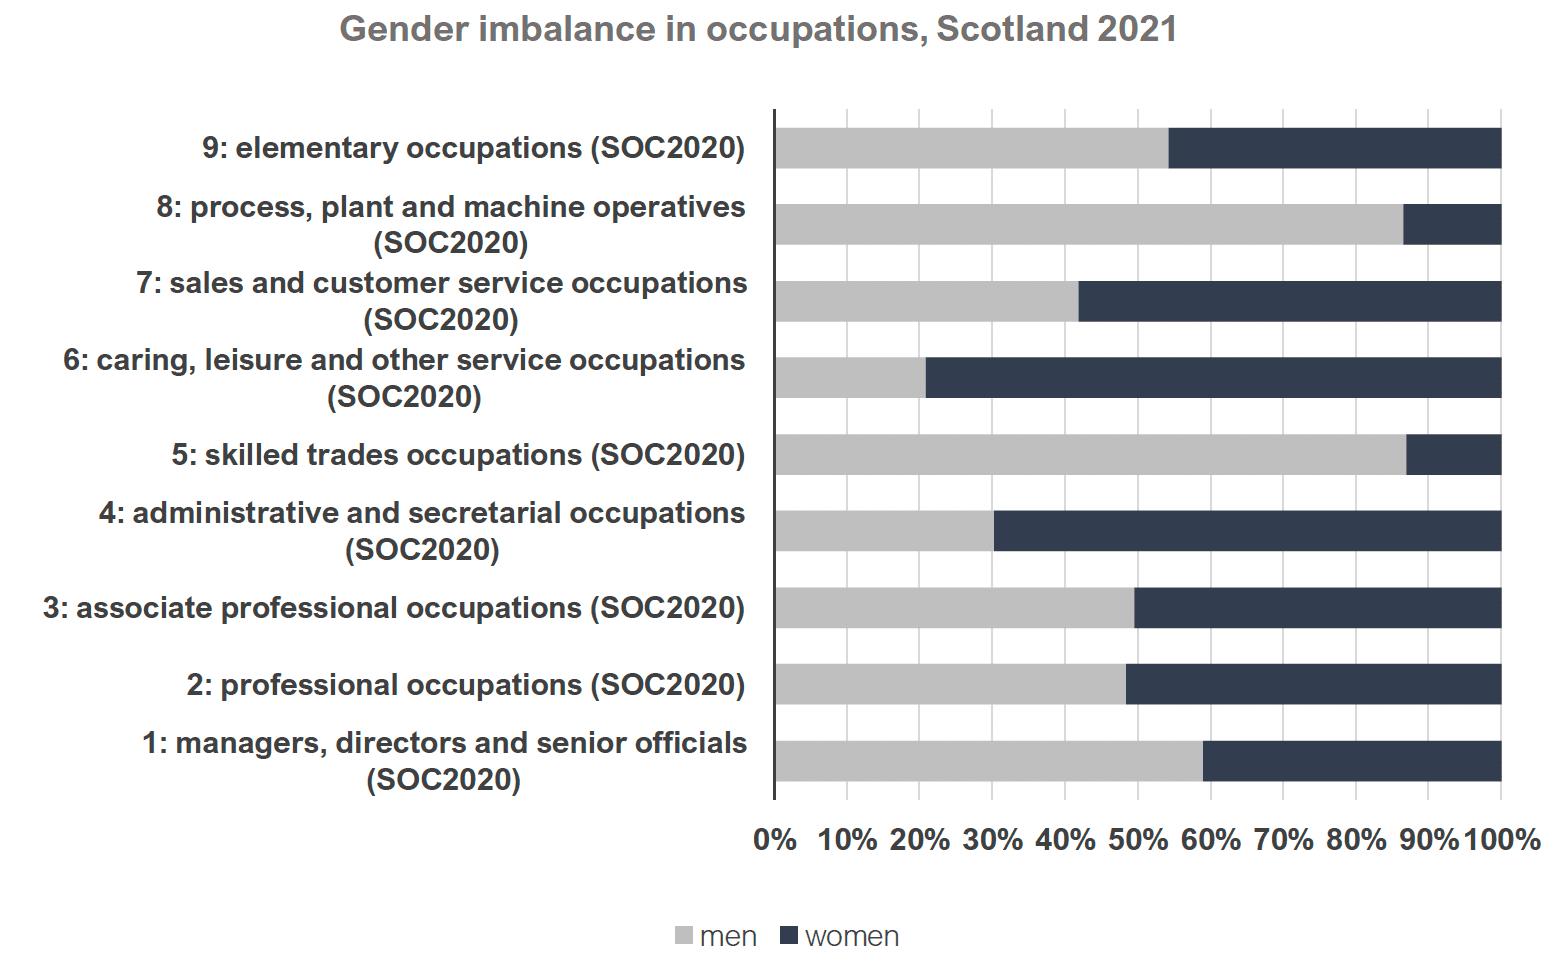
Consistent with the 2020 Fair Work in Scotland Report findings, there is still significant variation in the representation of women and men in occupations. There appears to be relatively equal representation in professional occupations, associate professional occupations and elementary occupations. There is an overrepresentation of men in skilled trade occupations (87.0% of workers), process, plant and machine operatives (86.5% of workers), and managers, directors and senior officials (59.0%). Women make up the majority of workers in caring, leisure and other service occupations (79.2%), administrative and secretarial occupations (69.8%), and sales and customer service occupations (58.1%).
Source: Annual Population Survey
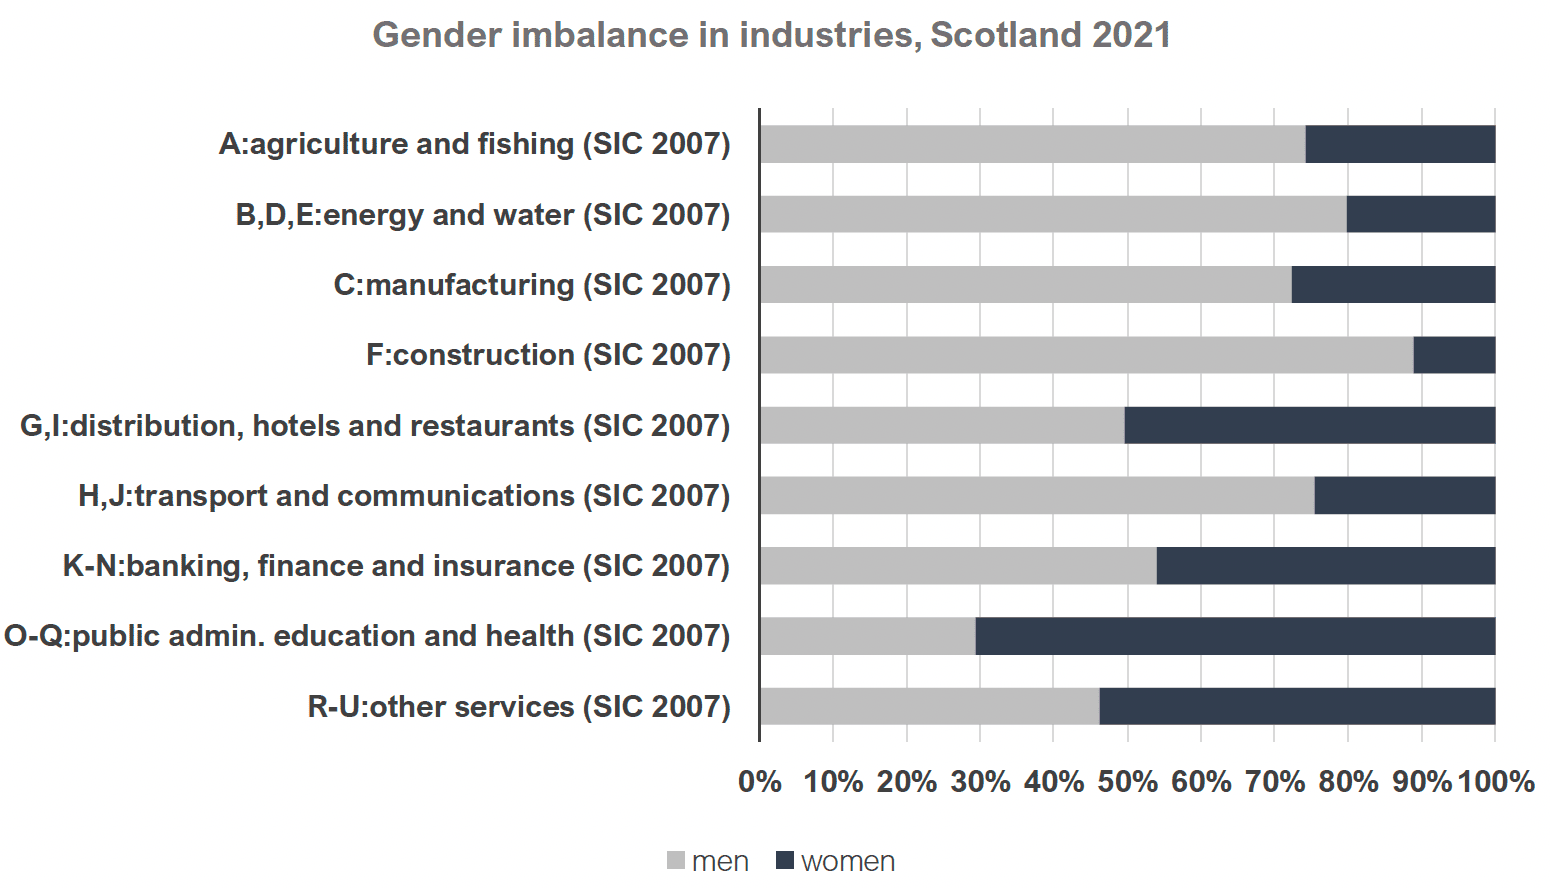
Similarly, there are significant imbalances in men's and women’s representation in Scottish industries. Specifically, men make up over 70.0% of the workforce in (i) agriculture and fishing (74.3%), energy and water (79.9%), manufacturing (72.4%), construction (88.8%), as well as transport and communications (75.4%). The remaining industries have equal representation except for public administration, education and health, where women are the majority of workers (70.6%). These findings are consistent with data from 2016 and 2019 with small changes (between 1-3 percentage points). The only sector where there has been a significant change between 2016-2021 is agriculture and fishing, where the share of women workers increased from 19.0% in 2016 to 26.0% in 2021.
Respect
| Indicator | 2016 |
2019 |
2021 |
Trend |
|---|---|---|---|---|
| Work-related ill health and disease: Self-reported illness caused or made worse by work per 100,000 workers |
3,560 per 100,000 workers (2013/14-2015/16 3-year average) |
3,280 per 100,000 workers (2016/17-2018/19 3-year average) |
4,870 per 100,000 workers (2019/20-2021/22 3-year average) |
Worsening |
| Working days lost due to ill health and disease: Average estimated number of working days lost per worker |
1.4 (2015/16-2017/18 3-year average) |
1.24 [26] (2018/19-2019/20 & 2021/2022 3-year average) |
1.24 (2018/19-2019/20 & 2021/2022 3-year average) |
Improving |
| Stress, anxiety, or depression caused by work: Self-reported stress, depression or anxiety caused or made worse by work per 100,000 workers |
1,340 per 100,000 workers (2013/14-2015/16 3-year average) |
1,630 per 100,000 workers (2016/17-2018/19 3-year average) |
2,860 per 100,000 workers (2019/20-2021/22 3-year average) |
Worsening |
| Working days lost due to stress, depression, or anxiety: Average estimated number of working days lost per worker |
0.68 (2015/16-2017/18 3-year average) |
0.76 (2018/19-2019/20 & 2021/2022 3-year average) |
0.76 (2018/19-2019/20 & 2021/2022 3-year average) |
Worsening |
| Workplace injuries: Rate of self-reported workplace non-fatal injury per 100,000 workers |
1,960 per 100,000 workers (2013/14-2015/16 3-year average) |
1,660 per 100,000 workers (2016/17-2018/19 3-year average) |
1,630 per 100,000 workers (2019/20-2021/22 3-year average) |
Improving |
| Working days lost as a result of workplace injury: Average estimated number of working days lost per worker |
0.14 (2015/16-2017/18 3-year average) |
0.21 (2018/19-2019/20 & 2021/2022 3-year average) |
0.21 (2018/19-2019/20 & 2021/2022 3-year average) |
Worsening |
| Fatal injuries: Number of fatal injuries to workers (includes employees and self-employed) |
15 workers |
11 workers |
15 workers |
Broadly stable |
| Discrimination, harassment and bullying at work: % of workers who report colleagues are rejected for being different |
N/A |
22.0% (2020) |
17.0% (2022) |
Improving |
| Discrimination, harassment and bullying at work: % of workers who feel that if they make a mistake, their manager will hold it against them |
N/A |
19.0% (2020) |
15.0% (2022) |
Improving |
| Discrimination, harassment and bullying at work: % of workers who report having experienced discriminatory behaviour |
N/A |
N/A |
7.0% (2022) |
N/A |
| Access to flexible working: % of workers with no access to flexible working options |
78.7% |
77.8% |
75.9% (2022) |
Improving |
Source: (i) Labour Force Survey – Health and Safety Executive Tables, (ii) Reporting of Injuries, Diseases and Dangerous Occurrences Regulations (RIDDOR) – Health and Safety Executive Tables, Working Lives Survey Scotland
Between 2016-2022, the 3-year average value of the rate of self-reported non-fatal injuries per 100,000 workers dropped to 1,630 per 100,000 in 2018-2022 compared to 1,930 per 100,000 in 2013-2016. Conversely, the average days lost due to workplace injuries per worker increased from 0.14 between 2015-2018 to 0.21 between 2018-2022.
The most significant changes were observed in the indicators for work-related ill-health and disease, and stress, anxiety, or depression caused by work. The rate of self-reported illnesses caused or made worse by work rose by 36.8% to 4,870 per 100,000 workers in the period 2019-2022 compared to 3,560 per 100,000 in 2013-2016. The rate of self-reported stress, depression, or anxiety caused by work per 100,000 workers in Scotland increased by 113.0% from 1,340 in the period 2013-2016 to 2,860 in 2019-2022.[27]
Finally, the proportion of workers with no access to flexible working arrangements improved in 2019 and 2021, reaching 75.9% compared to 78.7% in 2016, a 2.8 percentage point decrease.
The 2020 Fair Work in Scotland report highlighted that at the time there were gaps in data on some key indicators in the Respect dimension, specifically indicators on discrimination, harassment, and bullying.[28] New data collections related to discrimination, harassment, and bullying, indicate an improving performance of the Scottish labour market in these key areas. The percentage of workers who reported that people in their team rejected others for being different reduced to 17.0% in 2022 compared to 22.0% in 2020 and 20.0% in 2021. During the same period, the percentage of workers who feel that their manager would hold it against them if they made a mistake also reduced from 19.0% in both 2020 and 2021 to 15.0% in 2022. Finally, 7.0% of workers experienced discriminatory behaviour in 2022.
Security
| Indicator | 2016 | 2019 | 2021 | Trend |
|---|---|---|---|---|
| Permanent employment: % of workers in permanent employment | 94.2% | 95.1% | 95. 0 % | Fluctuating |
| Underemployment (hours insufficiency): % of workers looking for more hours, additional job, or a job with more hours than their current job | 8.9% | 7.2% | 6. 3% | Improving |
| Involuntary non-permanent work: % of workers in non-permanent work who could not find permanent employment | 32.1% | 25.0% | 28.7% | Fluctuating |
| Involuntary part-time work: % of part-time workers who could not find full-time employment | 14.1% | 10.5% | 13.7% | Fluctuating |
| Involuntary self-employed: % of workers who are self-employed as they could not find other employment | 3.7% | 2.8% | 2.0% (2022) | Improving |
| Hours of unpaid overtime: Average number of hours of unpaid overtime per week | 7.2 hrs | 7 hrs | 7. 7 hrs | Worsening |
| Median gross weekly earnings (nominal): Median gross weekly earnings of employees aged 16+ on the PAYE system | £431.6 | £472.8 | £528.6 (2022) | Improving |
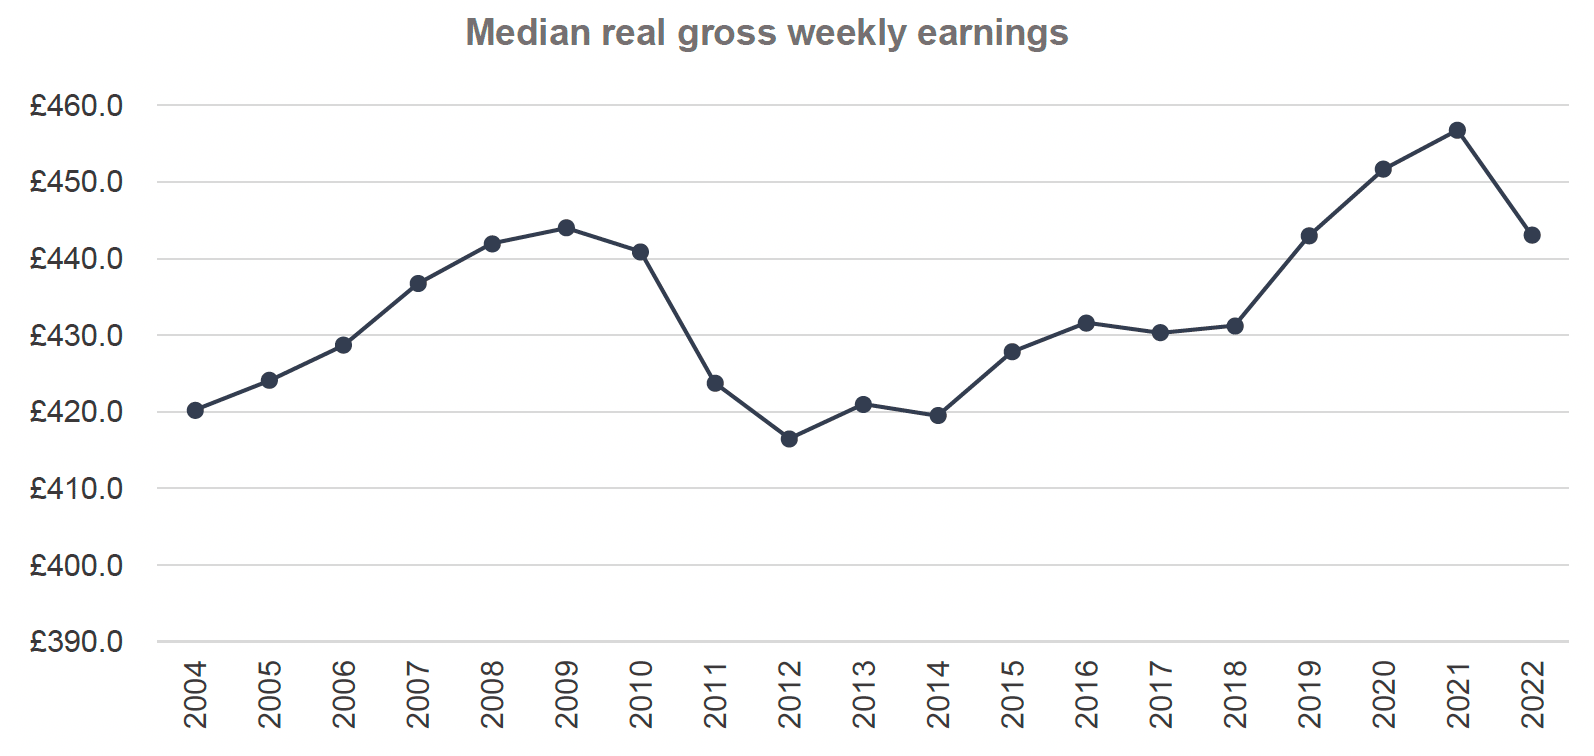
| Median gross weekly earnings (real): Median gross weekly earnings of employees aged 16+ on the PAYE system, adjusted for CPIH inflation rate based on 2016 prices.[29] | £431.6 | £443.0 | £443.1 (2022) | Improving |
| Real living wage: Proportion of employees (18+) earning less than the real living wage | 20.1% | 16.8% | 9.0% (2022) | Improving |
| Gender pay gap: Difference between men’s and women’s full-time hourly earnings as a percentage of men’s earnings | 6.4% | 7.2% | 3.7% (2022) | Improving |
| Disability pay gap: Difference between disabled and non-disabled median gross hourly pay | 13.7% | 16.2% | 18.5% | Worsening |
| Ethnicity pay gap: Difference in median gross hourly pay (excluding overtime) between white and minority ethnic workers | 7.5% | 9.6% | 5.9% | Fluctuating |
| Zero hours contracts: % of workers in zero hours contracts | 2.2% | 2.6% | 3.4% (2022) | Worsening |
Source: Annual Population Survey – Scottish Government Tables & Nomis Tables, Quarterly Labour Force Surveys, Scottish Government Annual Survey of Hours, and Earnings statistics tables, ONS - CPIH index
Nominal median weekly earnings have increased every year since 2016. Although real median earnings increased between 2019 and 2021 from £443 to £456.8, they declined to £443.1 in 2022.
Source: Annual Survey of Hours and Earnings
The proportion of workers earning less than the real living wage halved between 2016 and 2022. Furthermore, the gender pay gap shrank significantly as the difference between men's and women’s hourly rates fell from 6.4% in 2016 to 3.7% in 2022. Finally, there was a steady increase in the proportion of workers in permanent work from 94.2% in 2016 to 95.0% in 2021, with only a slight reduction to 94.6% in 2020.
Although there was an overall improvement, two indicators’ performance worsened over the last six years. The disability pay gap initially fell to 8.3% in 2018 before sharply increasing to 16.2% in 2019 and 18.5% in 2021. Additionally, the proportion of workers on zero hours contracts rose significantly from 2.2% in 2016 to 3.4% in the final quarter of 2022.
Indicators relating to involuntary non-permanent work and involuntary part-time work improved between 2016 and 2019, and then worsened between 2019 and 2021. The proportion of workers who were in non-permanent work because they were unable to find permanent employment reduced from 32.1% in 2016 to 25.0% in 2019, however, this proportion rose to 28.7% in 2021. Similarly, the proportion of part-time workers who could not find a full-time job reduced from 14.1% in 2016 to 10.5% in 2019, then rose to 13.7% in 2021.
Fulfilment
| Indicator | 2016 | 2019 | 2021 | Trend |
|---|---|---|---|---|
| Employer provided training: % of employers who provided training to their employees | 73.0% (2017) | 70.0% | 70.0% | Worsening |
| Workplace learning: % of employees who reported receiving job-related training within the last three months | 23.1% | 23.9% | 23.9% | Improving |
| Type of training: % of employees who received training both on the job & away, as a proportion of those who received any training | 22.6% | 23.9% | 20.4% | Fluctuating |
| Skills underutilisation (reported by employer): % of establishments with at least one employee with skills and qualifications more advanced than required for their current job role | N/A | 35.0% (2018) | 33.0% (2020) | Improving |
| Skills underutilisation (reported by worker): % of workers who report being overqualified for doing their current job | N/A | 29.0% (2020) | 32.0% (2022) | Worsening |
| Skills shortage vacancies: Proportion of establishments reporting at least one skills shortage vacancy | N/A | 6.0% (2018) | 5.0% (2020) | Improving |
| Autonomy/influence: Index of indicators that capture the % of workers that report having an influence on: (i) the tasks they do in their job, (ii) the pace at which they work, (iii) how they do their work, (iv) the time they start or finish their working day (base year 2020 = 100) | N/A | 100 (2020) | 102.9 (2022) | Improving |
| Problem solving: % of workers who feel their job involves solving unforeseen problems on their own | N/A | 61.0% (2020) | 61.0% (2022) | Broadly stable |
| Work intensity: % of workers who report that in a normal week, their workload is 'too much' or 'far too much' | N/A | 34.0% (2020) | 34.0% (2022) | Broadly stable |
Source: Scottish Employer Perspectives Survey, Scottish Employer Skills Survey, Annual Population Survey, Labour Force Survey, Working Lives Survey Scotland
Indicators relating to workers’ fulfilment recorded similar findings across the previous six years. Participation of workers in job-related training has exhibited a 0.8 percentage point increase from 23.1% in 2016 to 23.9% in 2021, similar to levels recorded in 2019 and up 1.2 percentage points compared to 2020.[30] At the same time, according to the Labour Force Survey (LFS), the proportion of employees offered training, both on the job and away, in Scotland rose between 2016-2019 from 22.6% to 23.9% before decreasing to 20.4% in 2021.
In terms of workforce skills and utilisation, the most recent findings from the 2020 Employer Skills Survey show a marginal improvement overall. The share of employers reporting having at least one worker who is overqualified fell to 33.0% in 2020 compared to 35.0% in 2018, and the share of employers reporting at least one skills shortage vacancy was 5.0% in 2020, compared to 6.0% in 2018. It is important to note that this data represents 2020 values, and hence these indicators may have changed significantly since then. Data from the Business Insights and Conditions Survey (BICS) suggests that in December 2022, 42.1% of businesses reported facing recruitment difficulties, while 26.9% of all businesses reported facing recruitment difficulties due to a lack of qualified candidates.[31] In the 2020-2022 Working Lives Survey that surveyed workers in Scotland regarding skill underutilisation, the percentage of workers who reported being overqualified in their current job rose from 29.0% in 2020 to 32.0% in 2022.
Additional indicators capturing key areas of job quality after 2020 remained broadly stable between 2020 and 2022. The percentage of workers who felt their workload was too high remained at 34.0% throughout this period, while the percentage of workers whose jobs involved autonomously dealing with unforeseen problems rose from 61% in 2020 to 63.0% in 2021 but dropped again to 61.0% in 2022. Finally, a composite index capturing the extent of control workers have over their own work showed moderate improvement in 2020-2022. Among the indicators comprising the index, the most significant change was among the percentage of workers who reported having an influence over the time they start or finish their working day which rose to 47.0% in 2022 compared to 44.0% in 2020. Indicators related to job autonomy, as well as job complexity and problem solving, are key for understanding worker fulfilment. Jobs where workers have a greater sense of autonomy in their work, and involve more novel tasks rather than monotonous tasks, are linked to higher productivity levels and job satisfaction among workers.[32]
Effective Voice
| Indicator | 2016 | 2019 | 2021 | Trend |
|---|---|---|---|---|
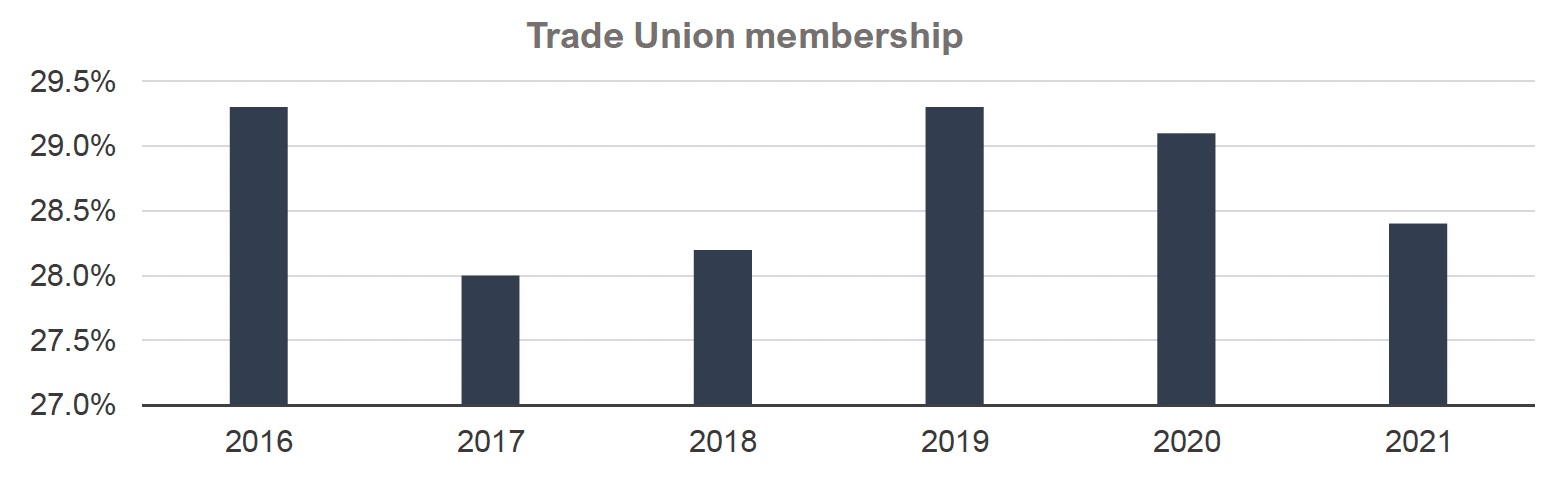
| Trade Union membership: % of workforce who reported they were members of a trade union/staff association | 29.3% | 29.3% | 28.4% | Worsening |
| Trade Union presence: % of workforce who reported others at their workplace were a member of trade union/staff association | 30.3% | 32.7% | 30.0% (2022) | Fluctuating |
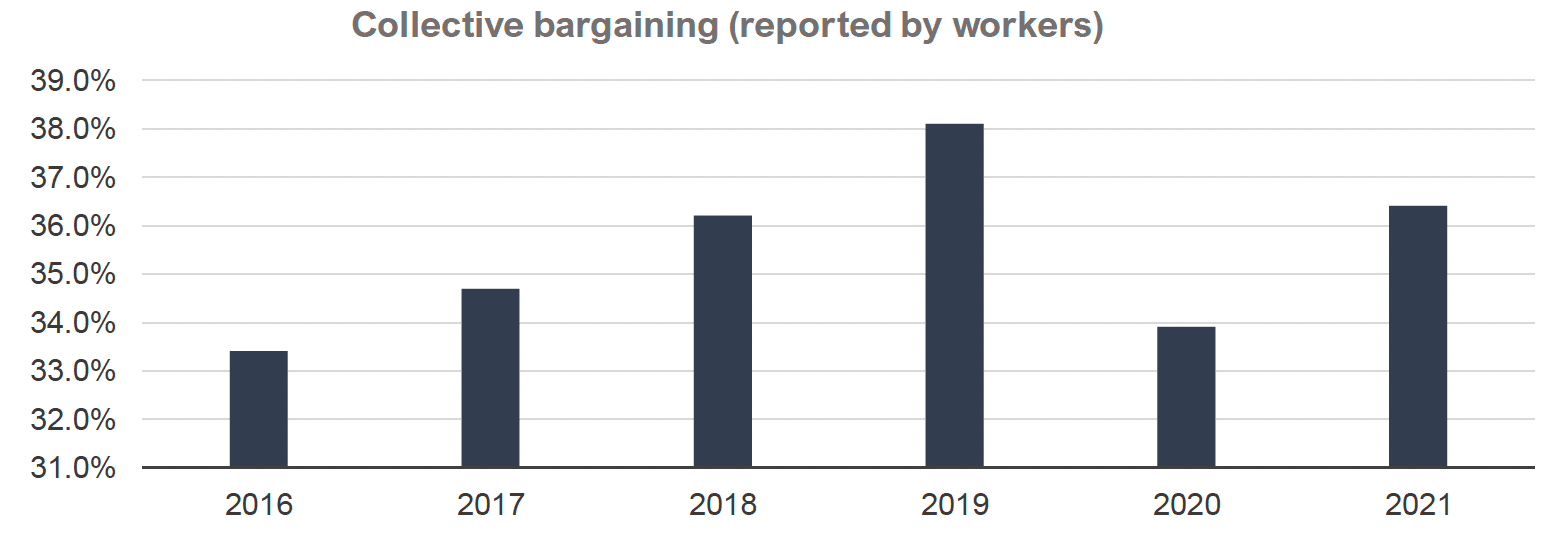
| Collective bargaining (reported by workers): % of workforce whose pay and conditions of employment are affected by agreements between their employer and a trade union/staff association (reported by workers) | 33.4% | 38.1% | 36.4% | Fluctuating |
| Collective bargaining (reported by employers): % of workforce whose pay and conditions of employment are affected by agreements between their employer and a trade union/staff association (reported by employer) | 51.3% | 51.6% | 52.5% (2022) | Improving |
| Adequate channels for employees to communicate, influence and negotiate: % of workers who feel they have no voice channel at work | N/A | 19.0% (2020) | 19.0% (2022) | Broadly stable |
Source: Department for Business and Trade and Department for Business, Energy & Industrial Strategy (BEIS), Trade Union Official Statistics Tables (Labour Force Survey), Quarterly Labour Force Survey Oct-Dec (2016, 2019, 2021), Working Lives Survey Scotland, Annual Survey of Hours and Earnings
Trade Union membership as a percentage of the workforce decreased from 29.3% in 2016 to 28.4% in 2021, reaching its lowest level in 2017 at 28.0%. Between 2017 and 2019, trade union membership increased while it remained broadly stable at 29.3% in 2019 and 29.1% in 2020. Similarly, although trade union presence increased by 2.4 percentage points between 2016 (30.3%) and 2019 (32.7%), it fell to 30.0% in 2022. While trade union membership and trade union presence maintained the same levels, the indicators measuring the percentage of workers whose pay and working conditions were affected by agreements between their employer and trade unions or staff associations showed an upward trend, climbing from 33.4% to 36.4% in 2021, more than 10 percentage points higher than the United Kingdom level (26%). As can be seen in Figure 6, in 2019, collective bargaining levels, as reported by workers, reached their highest level in Scotland since 2008 (38.1%). However, in 2020, there was a sharp decline to 33.9% before increasing to 36.4% in 2022.[33] However, it should be highlighted that data collection processes may have been affected during the years of the pandemic. Collective bargaining levels as reported by employers rose by 1.2 percentage points between 2016 and 2022 from 51.3% to 52.5%. Finally, from 2020 to 2022, the percentage of workers who felt they had no voice channel at work remained stable at 19.0%.
Source: Department for Business and Trade and Department for Business, Energy & Industrial Strategy (BEIS), Trade Union Official Statistics Tables (Labour Force Survey)
Source: Department for Business and Trade and Department for Business, Energy & Industrial Strategy (BEIS), Trade Union Official Statistics Tables (Labour Force Survey)
Evidence gaps and alternative measures
In addition to updating the Fair Work Measurement Framework indicators with the latest data, we also conducted a wider review to explore ways to address evidence gaps identified in the 2020 Fair Work in Scotland Report. Beyond the 39 indicators included in the Framework, the Fair Work Convention has identified eight additional indicators that were not measured due to data unavailability:
- Opportunity: Career progression
- Respect: Discrimination, harassment & bullying, and enforcement (including inspections)
- Security: Sick pay entitlement
- Fulfilment: Autonomy, problem solving, and work intensity
- Effective Voice: Adequate channels for employees to communicate, influence and negotiate
In this section, we discuss findings from our review of data sources to address evidence gaps, specifically the Working Lives Survey Scotland (WLS), Understanding Society, and Job Quality indicators in the Annual Population Survey (APS). After reviewing alternative and new data sources, we have addressed six out of eight evidence gaps. New indicators for each dimension of Fair Work are included in the relevant tables in the previous section (Tables 1, 2, 4 & 5). Moreover, we discuss findings from our review of sources for the two evidence gaps that were not addressed: (i) enforcement (including inspections) and (ii) sick pay entitlement. Finally, we propose an additional indicator related to flexible working to capture the incidence of working arrangements that involve working from home.
The 2020 Fair Work in Scotland Report identified a range of data gaps, especially in the dimensions of Respect, Fulfilment, and Effective Voice.[34] Since the 2020 Fair Work report, there has been significant progress in terms of data collected on these areas of interest, particularly through the Working Lives Survey Scotland carried out by the Chartered Institute of Personnel and Development (CIPD), and materialised and planned expansions of the job quality indicators included in the APS.[35] Since we understand that it is a key priority for the Fair Work Convention to broaden the scope of the existing framework, we recommend that evidence gaps and alternative measures remain a key area of research focus in the coming years. This will help improve and uplift the capacity of the Fair Work Measurement Framework to capture a comprehensive picture of work in Scotland.
Evidence gaps
We carried out a review of various sources in the public domain, including academic, policy and grey literature, as well as various data collections and surveys conducted in Scotland, to identify reliable data sources that have the potential to address these evidence gaps. There are three key criteria to consider when assessing a data source for inclusion in the Fair Work Framework: (i) its relevance to the Fair Work indicators, (ii) sample reliability, and (iii) whether the data is collected at regular intervals.
Working Lives Scotland survey (WLS)
The Working Lives Scotland survey (WLS) is a cross-sectional survey conducted by the Chartered Institute of Personnel and Development (CIPD) and includes a variety of indicators adapted from the CIPD Good Work index to fit the definitions under the Scottish Fair Work Framework.[36],[37] The WLS includes the sample for Scotland of CIPD’s wider UK Working Lives survey and a boosted sample for Scotland. The WLS is the first survey focusing on job quality in Scotland and has been running annually since 2020. Individuals are sampled from YouGov online panels to form a sample of 1,000-1,100 respondents each year.
The survey contains numerous questions with a very significant fit to the indicators on the Fair Work Framework, including indicators for which there has not been data collected previously, such as autonomy/influence at work, skills mismatch, adequate channels for employee voice, and career progression. Overall, we anticipate that if assessed as a good source to include in the Framework, five out of eight evidence gaps could be addressed. The two indicators for which there are no relevant questions in the WLS survey are sick pay entitlement and enforcement, including inspections.
The WLS survey can be a key source for addressing many of the evidence gaps in the Fair Work Framework previously identified in the 2020 Fair Work report. Tables 1-5 in the previous section include measures from the WLS that address five out of eight evidence gaps, specifically: (i) discrimination, harassment, and bullying, (ii) autonomy, (iii) problem solving, (iv) work intensity, and (v) adequate channels for employees to communicate, influence, and negotiate.
Furthermore, the WLS survey of 2022 included a question asking workers whether they feel their job offers good prospects for career advancement and a second question asking workers whether they feel their career progression to date has met or exceeded their expectations. However, we chose to address this evidence gap using data from the APS , as it is administered and published by the Office for National Statistics and is thus considered an established data source for labour market statistics.
Career progression
The Office for National Statistics is working to expand the range of indicators on job quality included in the APS in areas of interest directly related to the dimensions of Fair Work, including health, safety, and psychological well-being, voice and representation, terms of employment, and work-life balance. The Job Quality Indicators published by the Office for National Statistics (ONS) in 2021, drawing on data from the 2018 and 2021 APS, include an indicator on the percentage of workers who feel their job offers opportunities for career progression.[38] It is important to note that only the 2021 value of this indicator is included in the updated Fair Work Measurement Framework, as it is the first year this specific job quality indicator is reported.
Understanding Society
Wave 12 (2020-2021) of the UK Household Longitudinal Study (Understanding Society) included four modules that covered indicators related to fair work. Those were: (i) the work conditions module,[39] (ii) the job satisfaction module,[40] (iii) the employees module,[41] and (iv) the current employment module.[42] Among those, the module that includes the most questions that could potentially be used to address evidence gaps, or used as alternative measures, is the work conditions module, which covers topics such as work from home frequency, autonomy over tasks, formal and informal working arrangements, and work on weekends. However, the work conditions module is only included in the survey once every two waves and thus every two to four years. Moreover, indicators in the WLS are overall a better fit to the Fair Work dimensions and are collected annually. Thus, indicators from Understanding Society are not included in the Fair Work Measurement Framework.
Sick pay entitlement
Currently, no reliable sources would allow the Fair Work Convention to effectively estimate the amount of sick pay provided to employees, that is, whether employees receive sick pay as per statutory requirements or any additional sick pay related work benefits. The APS includes an indicator of whether workers who reported taking sick leave in the reference week received sick pay. However, the sample size is too small for estimates to be reliable as only a subset of workers is asked this question; specifically, only those who had a day off sick during the reference week are used to measure days and hours worked in a week rather than all workers.
Enforcement and inspections
Enforcement of Fair Work, including the number of workplace inspections, is a key area of interest in understanding progress towards safer and healthier standards for workers and the overall respect dimension. There are no regular data publications regarding inspections or any other enforcement measures. In May 2021, the Trade Union Congress conducted analysis which found that only one in 218 workplaces in the United Kingdom were inspected for safety failures during the pandemic.[43] This analysis was based on data provided by the Department for Work and Pensions.[44] and the Department for Business, Energy and Industrial Strategy [45] [46] through parliamentary questions.
Data collected included information on (i) the number of investigations carried out by the Employment Agency Standards Inspectorate as well as the budget level and numbers of FTE staff and Officers from 2018 to 2021, (ii) information on the matters being investigated by the Health and Safety Executive, as well as the number of HSE’s enforcement officers and inspectors from 2020 to 2021, and (iii) the number of workplace inspections, investigations, and front-line enforcement officers in the HM Revenue & Customs National Minimum Wage Enforcement Team, Health and Safety Executive, and Gangmasters & Labour Abuse Authority in 2019-20. As this data is aggregated at the UK level, it cannot provide insights into the number of inspections in Scotland, and additionally, this data is not published regularly.
Alternative Measures
Flexible work: The current measure of flexible working arrangements provides information on opportunities available for people to opt for different types of working arrangements e.g. flexitime, annualised hours contract, or 4.5-day week. Following the pandemic, there has been a substantial increase in the incidence of working from home and hybrid work patterns. In this context, it would be a beneficial addition to the Fair Work Measurement Framework to include an indicator related to homeworking which can be drawn from the APS. Additionally, as a potential measure of the labour market demand for flexible jobs, the Timewise Scottish Flexible Jobs Index tracks the proportion of jobs advertised in Scotland that offer flexible working options annually, disaggregated by sector, job type, and flexible work type.[47]