Chapter Two: International Fair Work Nation Framework
In the 2022/23 Programme for Government,[48] the Scottish Government reaffirmed its commitment to Scotland becoming a “leading Fair Work Nation” by 2025. In this chapter, we discuss the relative performance of Scotland compared to the leading performance in each sub-measure of the International Fair Work Nation Framework. This part of the report aims to identify areas where Scotland is performing well against its international comparators and areas of focus where there is significant room for improvement. Our discussion explores what constitutes leading performance in each sub-measure, and for indicators where Scotland is far from this goal, possible drivers of leading performance, examples of good policies, and best practice drawn from leading countries are discussed in reference to the policy context in Scotland.
Developing the Framework
Selecting comparator countries
To identify a list of comparator countries to Scotland, we followed a multiple-stage process to assess the comparability of different Organisation for Economic Co-operation and Development (OECD) countries with Scotland, considering (i) economic trends and outcomes, and labour market conditions and institutions, (ii) data availability and consistency, and (iii) the extent to which countries have control of relevant policy levers.
First, we carried out cluster analysis, which is a statistical technique used to group similar observations (in our case, countries) based on a set of variables. Using 2019 (pre-pandemic) OECD data on GDP per capita, population, unemployment rate, % of the labour force who are women, as well as employment rate of women, we identified the 12 countries with the highest level of similarity to Scotland based on the chosen indicators.[49] The countries were: Belgium, Finland, Austria, Sweden, Hungary, Iceland, Norway, Ireland, Denmark, Switzerland, Luxembourg, and New Zealand. We also conducted a data availability review on the Fair Work Measurement Framework indicators across 104 countries to understand for which indicators and countries there was sufficient data to make meaningful comparisons.
This initial selection of countries was narrowed down by excluding some countries with large differences in GDP per capita from Scotland (Switzerland, Luxembourg, Norway) and those with limited data availability (New Zealand). Following consultation with the Research Advisory Group, we also opted to add the Netherlands to the final list of comparators, as it is a country that combines a liberal market economy with certain aspects of economic planning and hence provides a useful contrast to some more co-ordinated market economies included in the International Framework. Finally, England was included to allow comparisons with a country within the United Kingdom. Overall, the countries selected are broadly similar to Scotland while also covering a range of different labour market characteristics.
The final list of comparator countries is Austria, Belgium, Denmark, Finland, the Netherlands, Ireland, Iceland, and England.
Indicators in the International Framework
Having an initial list of comparator countries, our team identified the indicators that are eventually included in the International Fair Work Measurement Framework based on data availability across countries, covering the majority of the dimensions of the Fair Work Measurement Framework.
The indicators in the International Fair Work Measurement Framework are presented below:
Opportunity: Disability employment gap; gender economic inactivity gap; youth unemployment rate
Respect: Incidence of workplace (non-fatal) injury per 100,000; workplace fatal injuries per 100,000; work-related ill-health
Security: Underemployment; gender pay gap; permanent employment; involuntary non-permanent work; involuntary part-time work; low pay
Fulfilment: Skills underutilisation (overqualification)
Effective voice: Trade union membership; collective bargaining
*NB: The same indicator across different countries may have been retrieved from different data sources, and the definitions of the indicator may differ across these sources.[50]
Defining the “leading” performance of Fair Work Nations
This report defines “leading” performance as the performance achieved by the country that leads the relevant sub-measure among the comparator countries in the International Framework. Thus, the Framework allows for the identification of the leading country in each outcome measure, setting the baseline to identify potential success factors and best practices. The development of the International Framework provides a comprehensive view of Scotland’s position in terms of Fair Work, highlighting areas of relevant strength and areas that require improvement. Areas where Scotland lags behind are focal points for further research and short- to medium-term efforts to achieve its 2025 Fair Work ambition.
The “leading” performance observed in the countries included in the Framework could serve as a benchmark for Scotland, representing a potentially achievable level of performance in the future. However, Scotland may differ from these countries in terms of institutional and labour market characteristics, which means that the potential values it could reach may differ from the current leading performance observed across the International Framework.
The Framework also helps understand the scale of Scotland’s ambition to become a Fair Work nation in the short and long term. For instance, Denmark stands out with exceptional performance in the disability employment gap measure, while Scotland aligns closely with countries such as Finland, the Netherlands, and Austria, which perform slightly better. Achieving performance similar to these comparator countries in the near future could be a feasible goal, while attaining the levels of the leading Fair Work nation becomes a longer-term objective. Conversely, in other measures where Scotland demonstrates stronger relative performance, achieving leading performance can be an immediate goal.
As can be seen in Table 6 and Figure 7, which present the ‘leading’ performance in each indicator and allow cross-country comparisons across all indicators included in the International Framework, a unitary definition of a “leading fair work nation” would not be possible, as different comparator countries do better and worse in different areas of Fair Work. No country performs well on every indicator.
Table 6 presents the overall results of the benchmarking exercise. Out of the fifteen indicators selected to be included in the International Fair Work Nation Framework, Scotland is leading the comparator countries in one (permanent employment), while it has the second best performance in two more indicators (youth unemployment rate and work-related ill health and disease). The countries with the highest number of first places are the Netherlands and Austria, each leading in three indicators. This is followed by Ireland, and Finland, each leading in two measures. Finally, the rest of the countries in the Framework, Belgium, Iceland, and Denmark, except for England, each lead in one indicator.
Cross-country comparisons across all indicators included in the International Framework are also depicted in the heatmap in Figure 7. The heatmap adopts a Red-Amber-Green (RAG) traffic light system to clearly present for each indicator of Fair Work, how each country performs, and how countries perform overall across all indicators. The colour scale ranges from dark green for leading performance to red for the performance observed in the last placed country in each indicator. The varying shades of light green to dark amber depend on each country’s figure distance from the maximum or minimum performance. The table also summarises each country’s average ranking across indicators.
| Dimension | Indicator | Leading country | Scotland’s position | Gap to leading country |
|---|---|---|---|---|
| Opportunity | Disability employment gap | Denmark (7.9 p.p.) | 6th out of 8 (31.2 p.p.) | 23.3 p.p. |
| Gender economic inactivity gap | Finland (3.1 p.p.) | 4th out of 9 (6.2 p.p.) | 3.1 p.p. | |
| Youth unemployment rate | The Netherlands (9.3%) | 2nd out of 9 (10.2%) | 0.9 p.p. | |
| Respect | Workplace non-fatal injuries | Ireland (526.3 per 100,000 workers) | 5th out of 9 (1630 per 100,000 workers) | 1103.7 per 100,000 workers |
| Work-related ill health and disease | Ireland (3.1%) | 2nd out of 9 (4.9%) | 1.8 p.p. | |
| Security | Gender pay gap | Belgium (5.0%) | 4th out of 9[51] (11.6%) | 6.6 p.p. |
| Underemployment | Austria (3.5%) | 6th out of 9 (6.3%) | 2.8 p.p. | |
| Permanent employment | Scotland (95%) | 1st out of 9 | - | |
| Involuntary non-permanent work | Austria (3.7%) | 7th out of 9[52] (28.7%) | 25 p.p. | |
| Involuntary part-time work | Netherlands (3.7%) | 6th out of 9 (13.7%) | 10 p.p. | |
| Low pay | Netherlands (6.5%) | 5th[53] out of 8[54] (9.6%) | 3.1 p.p. | |
| Fulfilment | Skills underutilisation | Finland (8.4%) | 8th out of 8 (29%) | 20.6 p.p. |
| Effective Voice | Trade Union membership | Iceland (91.4%) | 5th out of 9 (29.3%) | 62.1 p.p. |
| Collective bargaining | Austria (98%) | 7th out of 9[55] (38.1%) | 59.9 p.p. |
| Scotland | Austria | Belgium | Denmark | England | Finland | Iceland | Ireland | Netherlands | |
|---|---|---|---|---|---|---|---|---|---|
| Disability Employment Gap | 31.2 | 26.3 | 38 | 7.9 | 25 | 22.2 | No data | 41.3 | 25.8 |
| Gender economic inactivity gap | 6.2 | 8.6 | 8 | 6 | 7.3 | 3.1 | 5.5 | 9.5 | 6.9 |
| Youth unemployment rate | 10.2% | 12.0% | 18.2% | 10.8% | 12.8% | 17.1% | 12.0% | 14.5% | 9.3% |
| Workplace non-fatal injuries | 1630 | 1416.5 | 2234.9 | 2565.2 | 1800 | 4025.1 | 553.1 | 526.3 | 997.1 |
| Work-related ill health and disease | 4.9% | 13.2% | 9.5% | 9.0% | 5.1% | 25.7% | 9.4% | 3.1% | 7.4% |
| Gender pay gap[56] | 11.6% | 18.8% | 5.0% | 14.2% | 16.2% | 16.5% | 10.4% | 9.9% | 13.5% |
| Underemployment | 6.3% | 3.5% | 6.0% | 3.9% | 7.3% | 6.7% | 3.8% | 5.8% | 7.2% |
| Permanent employment | 95.0% | 91.0% | 89.7% | 89.1% | 94.4% | 83.7% | 83.8% | 89.6% | 71.8% |
| Involuntary non-permanent work[57] | 28.7% | 3.7% | 29.8% | 16.8% | 28.9% | 25.0% | 7.6% | 17.2% | 15.8% |
| Involuntary part-time work | 13.7% | 9.2% | 21.4% | 9.3% | 11.8% | 31.6% | 15.4% | 12.6% | 3.7% |
| Low pay | 9.6% | 14.7% | 11.5% | 8.7% | No data | 8.6% | 7.6% | 18.0% | 6.5% |
| Skills underutilisation - overqualification[58][59] | 29.0% | 20.0% | 10.8% | 17.1% | No data | 8.4% | 23.2% | 10.6% | 15.0% |
| Trade union membership | 29.3% | 26.2% | 49.1% | 67.0% | 22.1% | 58.8% | 91.4% | 24.9% | 15.4% |
| Collective bargaining[60] | 38.1% | 98.0% | 96.0% | 80.3% | 24.8% | 89.2% | 90.0% | 34.0% | 75.6% |
| Average ranking | 4.9 | 4.6 | 5.6 | 4.1 | 5.9 | 5.6 | 3.7 | 5.1 | 4.5 |
Note: This heatmap presents the relative performance in the Fair Work indicators using varying shades of blue, from white (indicating the lowest performance) to dark blue (representing leading performance). Grey cells signify a lack of data. The table also includes a row that presents each country’s average ranking across indicators. (please see PDF for colour reference)
Opportunity
Disability employment gap
As shown in Figure 8, in 2021, the difference in employment rates between people who have a disability as defined under the Equality Act 2010 and those who are work-limited or disabled and people with no disability or work limitations in Scotland was 31.2 percentage points, which was the sixth narrowest gap among the eight countries for which there is data.[61] Scotland outperforms Belgium and Ireland, however, shows worse performance compared to Denmark, Finland, England, the Netherlands, and Austria. Denmark is clearly leading in this sub-measure, as the disability employment gap is at 7.9 percentage points, which is 14.3 percentage points narrower than second best Finland (22.2 p.p.). Finally, there are no data collected for this measure from Iceland.
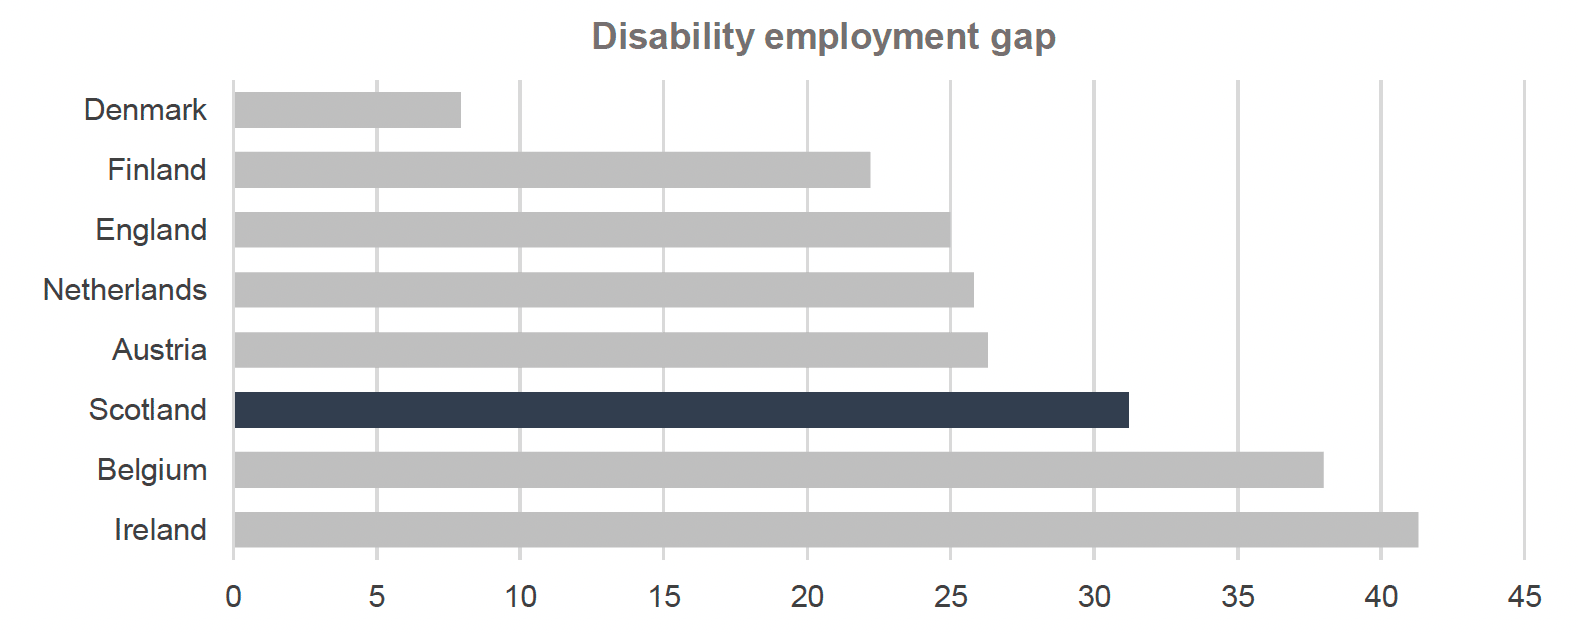
Source: (i) Scotland and England: Annual Population Survey, (ii) Comparator countries: Eurostat – European Union Labour Force Survey (EU-LFS)
Exploring factors of success
In the United Kingdom, the core legislation protecting the equal treatment of workers in the workplace is the Equality Act 2010, which replaced the Disability Discrimination Act of 1995. Most of the equalities legislation in effect in Scotland is reserved to the UK government under the Scotland Act of 1998.[62] Under the Equality Act, employers are required to make reasonable adjustments to accommodate disabled people where necessary, including: (i) providing more flexible working hours, (ii) giving or arranging training, and (iii) making adjustments to premises and acquiring or modifying equipment.
While anti-discrimination legislation is in place, both the United Kingdom and Scotland are underperforming significantly in various indicators of equality of opportunity for disabled people. While the disability employment gap captures the overall situation, other inequalities also lead to differences in the quality and quantity of work that non-disabled people can access compared to disabled people. As of 2021, in the UK, disabled people were less likely to have a qualification and, specifically, considerably less likely to have a university degree, hindering their competitiveness in the labour market.[63] Furthermore, prior to the Covid-19 pandemic, disabled people in the UK were more likely to work part-time, were underrepresented in higher-skilled work, and earned, on average, 12% less than non-disabled workers. Finally, the UK ranks among the lowest OECD countries in terms of its expenditure as a share of its GDP on active employment measures. On the contrary, Denmark is among some of the OECD countries with the highest spending, which has been found to be linked with a higher capacity to support disabled people back into employment after recessions.[64] Indeed, the disability employment gap in Denmark halved between 2020 (18.1 percentage points), a year affected by the pandemic, and 2021 (7.9 percentage points). Over the same period, the disability employment gap in Scotland narrowed by 2.2 percentage points from 33.4 to 31.2 percentage points.
Denmark invests significantly in active employment measures, investing £10.9 billion[65] in 2019 on activation and other employment schemes.[66] Active employment measures include: (i) subsidies to firms for a disability-friendly design of workspaces, as well as acquiring any tools and aids that disabled workers may use, and (ii) support for job centres across the country in providing services to people with limited working capacity, through various employment initiatives, seminars, networking activities, and online resources.
Furthermore, according to the Danish Agency for Labour Market and Recruitment, there are several additional measures in place to support placing disabled people in employment in Denmark.[67] Such measures include those under the Act on Compensation for Disabled Persons in Employment, consisting of three schemes that aim to stimulate the hiring and retention of people with disabilities: (i) offering subsidies towards the remuneration of people to assist a disabled employee who requires personal assistance, (ii) wage subsidies for a period of up to one year to hire disabled people who have completed an educational programme lasting at least 18 months in the last two years, and (iii) preferential access to disabled applicants in filling a vacant position in the event that disabled and non-disabled candidates for a job have the exact same qualifications.
Reducing the disability employment gap is a key policy commitment for the Scottish Government. Scotland has set out a comprehensive set of policies aimed at supporting the participation and inclusion of disabled in the workplace through its 2018 ‘A Fairer Scotland for Disabled People: Employment Action Plan’,[68] its ‘Recruitment and retention plan for disabled people: 2019’,[69] as well as the 2022 Fair Work Action Plan.[70] However, overall, it appears that there is still significant progress to be made for Scotland to become a leading nation in this area. The disability employment gap should remain a key policy focus in Scotland in order to achieve its Fair Work ambitions by 2025 and beyond.
Gender economic inactivity gap
Among the countries included in the International Fair Work Nation Framework, Finland has the smallest difference between the economic inactivity rates of men and women in 2021, as the economic inactivity of women is 3.1 percentage points higher than that of men. Scotland outperforms most countries in the framework, ranking fourth out of nine, with a gender economic inactivity gap of 6.2 percentage points in 2021. Other than Finland, the other two countries with a narrower gender economic inactivity rate gap are Iceland and Denmark, at 5.5 and 6 percentage points respectively. The worst performing country in the International Framework for this sub-measure is Ireland, where the economic inactivity rate of women was 9.5 percentage points higher than that of men.
Scotland’s gender economic inactivity gap is largely on par with or better than most of the comparator countries considered in this research. Scotland’s gender economic inactivity gap is 0.2 percentage points wider than third place Denmark, and 0.7 percentage points wider than second placed Iceland.
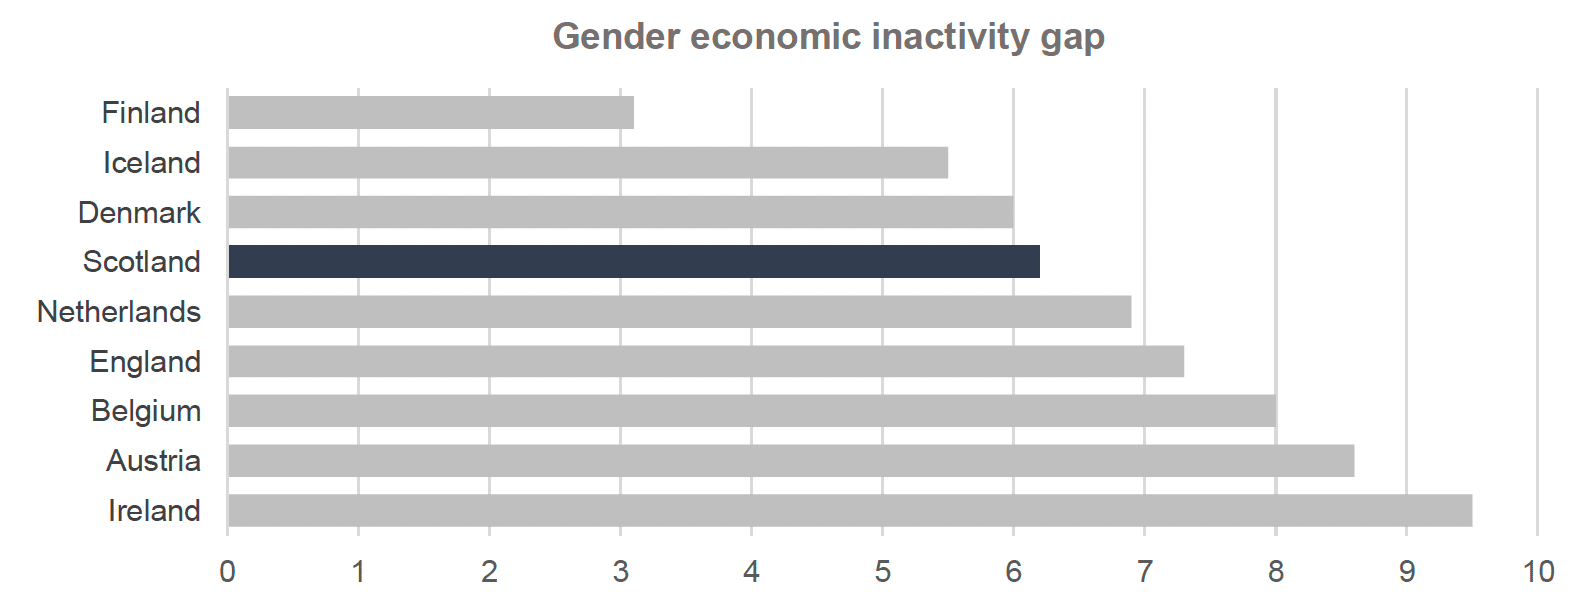
Source: (i) Scotland and England: Annual Population Survey, (ii) Comparator countries: International Labour Organisation - ILOSTAT, Labour Force Statistics (LFS)
Exploring factors of success
In the United Kingdom, according to Office for National Statistics (ONS) data, in the final quarter of 2022 (October-December), 28.2% of women aged between 16-64 who were economically inactive reported looking after family or home as the main reason, making it the most common reason followed by long-term sickness (25.8%), studies (21.1%), and retirement (11.9%). Looking after family is an even bigger barrier to work for economically inactive women who would like to work[71] of whom 33.9% reported looking after their family or home as the main reason for being economically inactive. On the contrary, the most common reasons among men were studies and long-term sickness, with just 6.4% of men being economically inactive because of looking after their family or home.[72]
Looking after young children or family in the United Kingdom is a barrier to employment disproportionately more often for women than for men. Although this is not a single reason for this trend, the relatively high cost of childcare may be a contributing factor. In 2021, in Scotland, a 25-hour per week childcare place on average costed parents of children under two years old £117 per week or over £6,000 per year. Furthermore, a full-time 50-hours per week childcare place in a nursery costed £227 per week on average for two-year-olds, and £228 for children under two, which amounts to approximately £11,800 per year.[73]
Maternity leave
A study on OECD countries found that long-term female labour force participation trends can be influenced by several institutional and contextual factors, including the overall structure of the labour market, whether the institutional setting supports a positive work-life balance and the improvement of women’s educational attainment.[74] Consistent with findings on the reasons for women’s economic inactivity, it was also found that policies that support the increased enrolment of children in childcare and higher public spending for childcare, as well as higher public spending for paid maternal and/or paternal leave, can positively increase the incidence of full-time female employment.[75] A study using data on maternity leave and female labour force participation in 159 countries found maternity leave has an ambivalent effect on female labour force participation. Specifically, findings suggested an inverted U-shaped relationship between the two variables. It was found that maternity leave of between 25 to 34 weeks can achieve the most optimal outcomes for female labour participation. Increasing the maternity leave by up to 25 weeks positively affects female labour force participation. However, increasing maternity leave beyond 34 weeks was found to have a negative effect on female labour force participation rates.[76],[77]
Like other Nordic countries, Finland has significant policies in place to support families with children and ensure that raising children is not a barrier to labour force participation.[78]
In Finland, parental leave lasts for 320 working days (64 working weeks), 160 days (32 weeks) for each parent, with the option for each parent to exchange 63 days of their parental leave with their partner. The leave can be taken at any time period between when the child is born and when the child turns two years old.[79] Parents can only take 18 working days of leave simultaneously, ensuring that the days of leave can last up to 14 months. Parental allowance, which amounts to approximately 70% of the parent’s wage, can be paid to the parent on parental leave during all days of their parental leave by the State’s Social Insurance Institution, Kela.[80] Mothers are also entitled to pregnancy leave for 40 working days (8 weeks) before birth, which is mandatory for at least 14 week-days before the due date. Finally, after a child turns 3, a parent can take additional unpaid childcare leave for which parents may be eligible to receive an allowance from the State.[81]
In Scotland, mothers are entitled to up to 52 weeks of statutory maternity leave (260 working days), including any leave for the period of pregnancy. The 52 weeks of statutory leave comprise 26 weeks of Ordinary Maternity Leave and 26 weeks of Additional Maternity Leave. Statutory paternity leave is limited to up to two weeks (10 days).[82] Under the law, 39 of the 52 weeks of maternal leave must be paid in the UK. Also, mothers can share up to 50 weeks of their maternity leave, including up to 37 weeks of paid maternity leave, with their partners.[83] Beyond the statutorily prescribed terms of parental leave, employers can, at their discretion, offer longer parental leave and paid parental leave to prospective parents. Ensuring the enforcement of these provisions is key, as research by the Equality and Human Rights Commission (EHRC) in 2015 found that 11% of new mothers are forced out of jobs in the UK every year, while one in five mothers said they experienced negative comments and harassment from their employer related to their pregnancy and flexible working required.[84]
Childcare
Families in Finland can seek childcare for their children as early as the age of nine months old. According to Finnish legislation, preschool children have a right to early childhood education and care, and local authorities are responsible for ensuring equal access to early childhood education for all children.[85] Childcare is provided by local authorities or private providers supervised by the local authority.[86] Childcare fees can be significantly more affordable in a Finnish local authority than in the UK average. Fees are decided based on family income, and in the municipality of Helsinki, the maximum level for full-time day-care for a family’s youngest child, in nominal terms, is £255 per month or £2,806 annually. Additional children receive significantly discounted fees, with the maximum fee for the second youngest child at £102 per month or £1,123 annually.[87],[88],[89] As noted, in Finland, childcare fees are determined based on income and family size, and the childcare fee charged can be considerably lower than the maximum rate. The lowest fee offered by the Municipality of Helsinki is £24 per month or £266 annually.[90] Finally, families seeking childcare from private providers can receive financial support from their local authority.
The highest of the aforementioned fees for childcare (£2,806 annually) is less than half of what the average household pays for 25 hours of childcare per week for two-year olds in Scotland (over £6,000 annually).[91]
The Scottish Government offers households assistance with covering the costs of childcare, although the majority of this becomes available after a child turns three years old. Since 2020, children that are three and four years old[92] are eligible for 1140 hours of state-funded childcare per year, or 30 hours per week for 38 weeks per year.[93] Furthermore, the UK Government offers £2,000 of financial assistance towards childcare costs for each child under 11 years old per year and £4,000 for children who have a disability.[94]
Early learning and childcare appear to be a key priority for the Scottish Government in the medium term. In the 2021 Programme for Government, the Scottish Government committed to expanding the offer of funded Early Learning and Childcare to all one- and two-year olds starting with lowest income families.[95] Finally, the latest 2022 Programme for Government pledged to carry out further research and engagement to inform developing a renewed childcare and early education offer.[96]
Strong family support, including longer periods of parental leave, which split between the two parents can last up until when a child is 14 months old, and earlier access to partially state-funded childcare as early as when a child is nine months old and throughout pre-education, can help offer mothers more opportunities to successfully rejoin the labour market and minimise any adverse impact from creating a family to their careers.
Scotland has been making significant progress in expanding the offer of state-funded childcare in recent years. More research is also warranted on maternity and parental leave to ensure that families can access the support they need before their children are eligible for state-funded childcare.
Youth unemployment rate
As can be seen in Figure 10, Scotland has the second lowest youth unemployment rate among the comparator countries at 10.2%. Scotland is second to the Netherlands on this measure, which has a youth unemployment rate of 9.3%, 0.9 percentage points lower than Scotland. Thus Scotland’s youth unemployment rate is lower than that of Denmark, Iceland, Austria, England, Ireland, Finland, and Belgium.
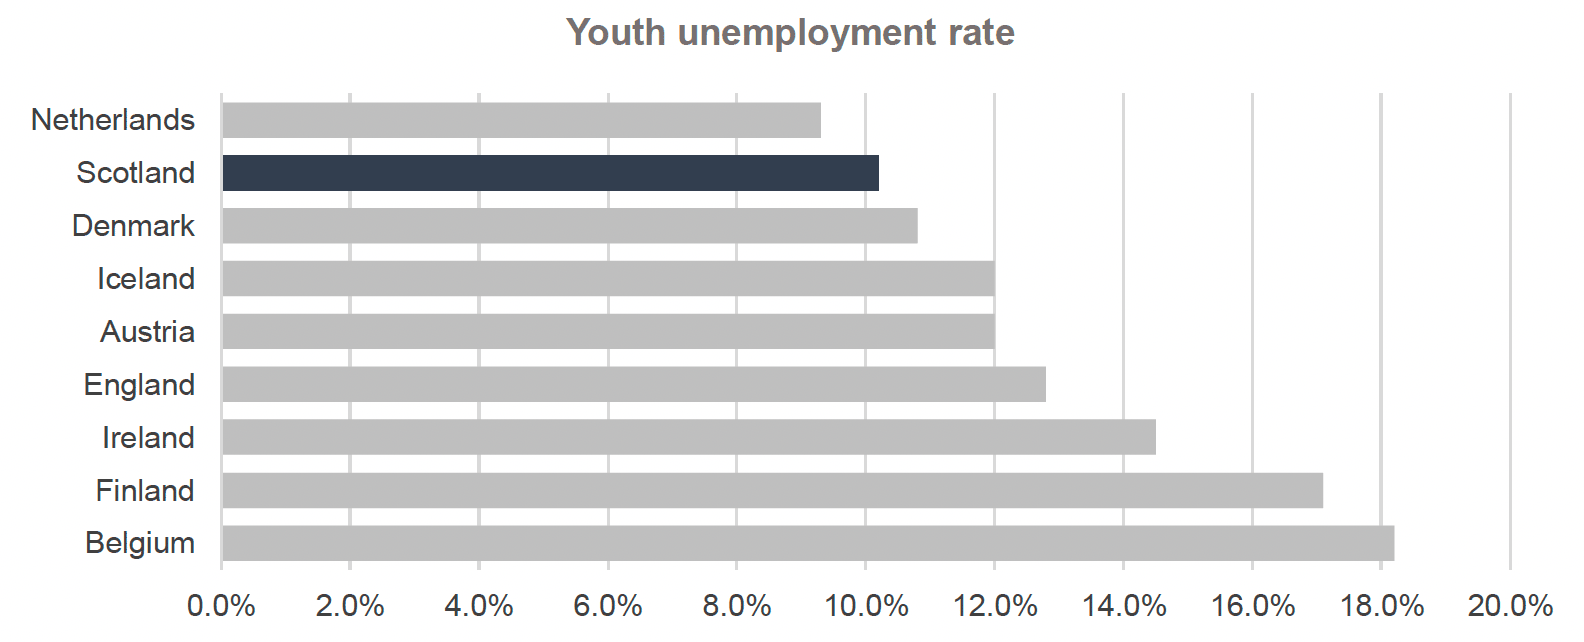
Source: (i) Scotland and England: Annual Population Survey (ii) Comparator countries: International Labour Organisation - ILOSTAT, Labour Market-Related SDG Indicators (ILOSDG database)
Exploring factors of success
The youth unemployment rate is dependent on a wide range of economic factors. A share of youth unemployment can be attributed to young people who are facing multiple disadvantages, often having no qualifications, living in disadvantaged or remote areas, and coming from an immigrant or minority background.[98] However, the most common type of youth unemployment observed is due to the poor integration of new entrants into the labour market. Educationally qualified new entrants to the labour market often experience challenges leading to unemployment, higher temporary work, precarious employment, and even periods of economic inactivity. This is a phenomenon that affects approximately 20-30% of all young people in OECD countries.[99]
A study on the characteristics of youth unemployment in Europe identified some key factors influencing youth unemployment, including labour market flexibility, family legacy (experiencing a parent with long spells of unemployment), youth migration, and education, skills, and qualifications mismatch.[100] A wide range of policy initiatives to support youth employment in Europe has focused on improving the transition from formal education to employment, ensuring that young people receive work-relevant skills, achieving broad access to education and training for vulnerable young people, and ensuring that young people are matched to jobs suited to their skills. The transition from education to employment is a particularly important step as studies suggest that qualifications and skills mismatch at the point of entry to the labour market can lead to persistent mismatch later in someone’s career.[101]
A different study on youth unemployment also highlighted the importance of effective school-to-work and education-to-work transition systems and the growing issue of skills mismatch in youth employment in Europe.[102] According to this study, school-to-work transition systems can be sequential, i.e., people develop work-related competencies after formal education or dual, i.e., the education system can provide work-related skills (e.g. apprenticeships). Countries that are performing well in youth employment are characterised by dual education systems that are highly integrated with the labour market and provide young people with work-related skills.[103],[104] Additionally, a labour market system of ‘flexicurity’ can be important.[105] A flexible labour market is crucial for creating opportunities for young people to take the first steps in their careers and gain important skills. However, this must be supported by higher income and employment stability for individuals.[106]
Scotland performs similarly to the leading country in the International Framework, outperforming most of its comparators. The latest unemployment forecast by the Office for Budget Responsibility predicts the unemployment rate in the United Kingdom to remain similar and slightly lower than in 2021 over the next few years.[107] Overall, Scotland is on a positive trajectory, with an overall low youth unemployment rate that is predicted to remain stable.
Respect
Although Scotland is not the leading country in the Respect dimension of the International Fair Work Nation Framework, it compares moderately in measures on this dimension with other countries. Scotland is second in the prevalence of work-related ill health and disease among workers and fifth in workplace non-fatal injuries per 100,000 workers in 2020, out of the nine countries in the International Framework.
Workplace non-fatal injuries
In 2021, Ireland and Iceland were leading this measure, with the self-reported workplace non-fatal injuries rate being 526.3 per 100,000 workers and 553.1 per 100,000 workers respectively. Scotland performed moderately in this measure, fifth among nine countries with an annual average of 1,630 incidents per 100,000 workers in the 3-year period 2019-2022. The closest comparator countries to Scotland on this measure are Austria at 1,416.5 per 100,000 workers in 2021, and England with a 3-year average for the period 2020-2022 of 1,800 non-fatal injuries per 100,000 workers.
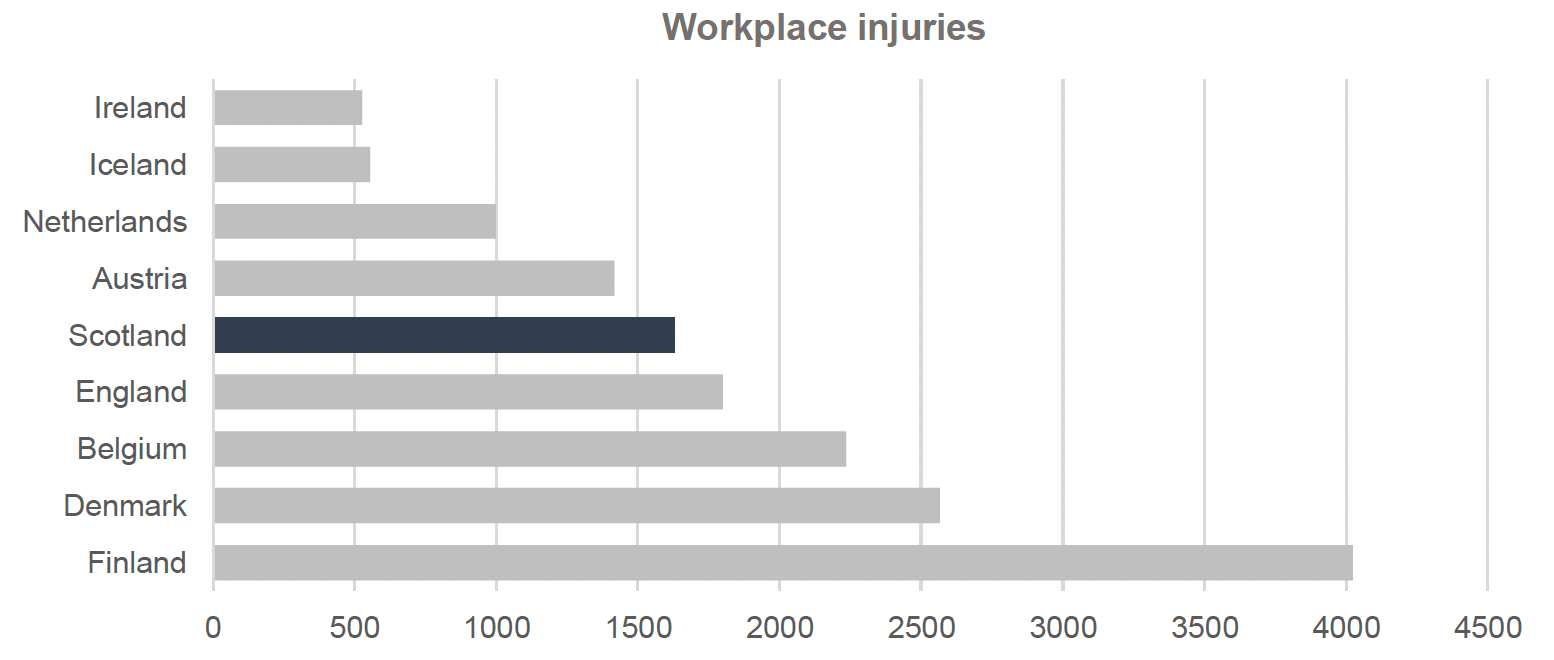
Source: (i) England and Scotland: Labour Force Survey – Health and Safety Executive Tables, (ii) Comparator countries: International Labour Organisation - ILOSTAT, Labour Market-Related SDG Indicators (ILOSDG database)
Exploring factors of success
According to the data in 2021, and as can be seen in Figure 11 above, there were approximately 87.0% fewer workplace injuries per worker, or 3,495 less per 100,000 workers, in best-performing Ireland (526.3 workplace injuries per 100,000 workers), than there were in the lowest-performing Finland (4,021.1 workplace injuries per 100,000 workers). This finding warrants further investigation, however, some examples of possible reasons for a significant spread of values in this indicator among the countries in the International Framework could be differences in data collection methods (e.g. better monitoring and reporting in Finland) or differences in the employment structure (e.g. if a larger share of the workforce works in industries that have a higher risk of injuries in the worse performing countries). In general, it is challenging to draw comparisons on indicators related to injuries and safety at work. According to the Health and Safety Executive, health and safety systems can vary across Europe in terms of processes for recording and reporting incidents, as well as enforcement.[109] Consequently, data from different countries may not be directly comparable.
A Health and Safety Executive[110] study of various indicators related to those reported here found that in 2019, among the countries included in the International Framework, Ireland had the highest percentage of businesses that provided a note explaining responsibilities and procedures related to health and safety to workers. That figure was 97.3% for Ireland in 2019, compared to 96.7% for the United Kingdom and 91% European Union 27 (EU-27) average. In the same year, the UK surpassed Ireland in a measure of the percentage of establishments that carry out workplace risk assessments.
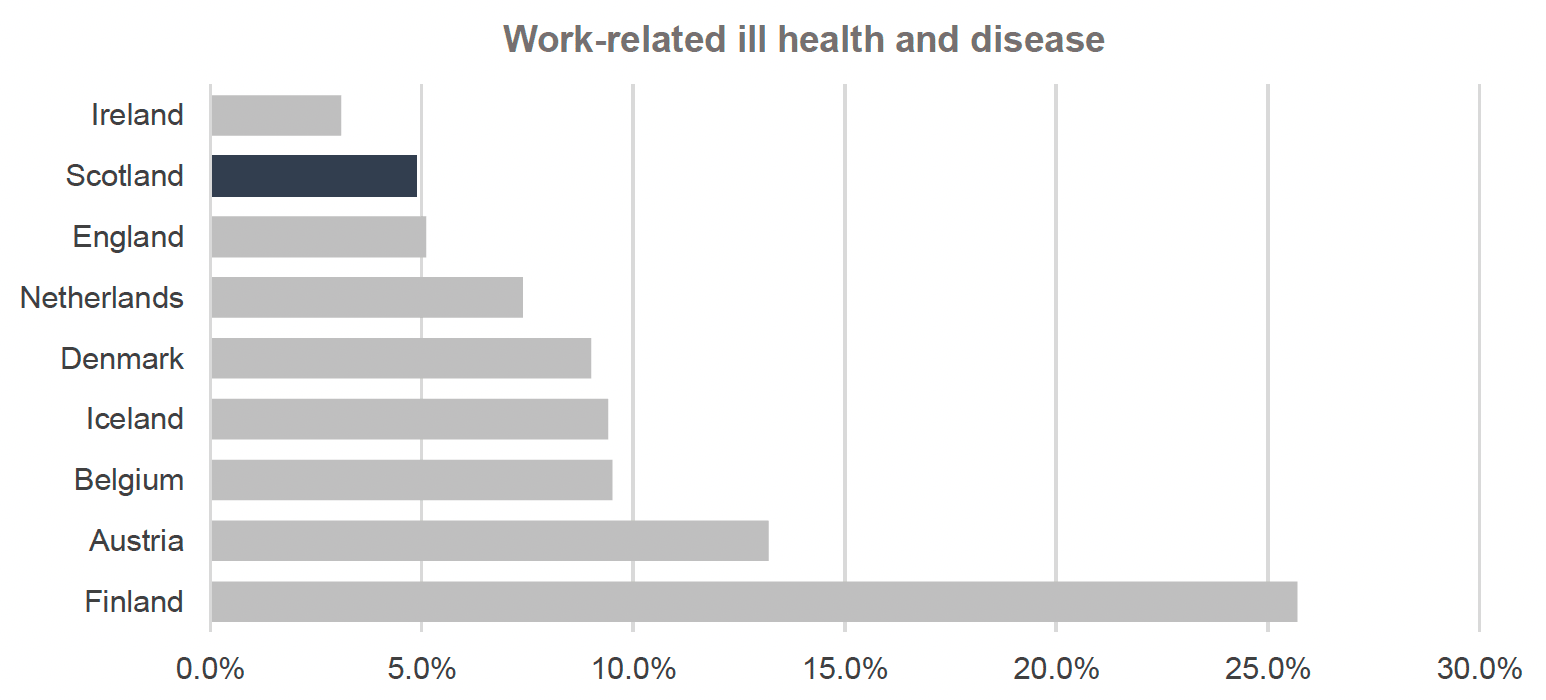
Work-related ill health and disease
In the indicator for the prevalence of work-related ill health and disease among workers, Ireland is again the strongest performing country among the comparators, with 3.1% of workers reporting illness caused or made worse by work, compared to 25.7% of workers in Finland. Scotland performs strongly compared to the rest of the countries in the framework, with the percentage of workers reporting work-related ill health and disease at 4.9%, ranking second out of nine countries, as indicated in Figure 12. Similarly to the indicator for workplace injuries, the significant difference between the best and worst performing countries may be due to several reasons, including monitoring and reporting processes and definitions of ill-health caused by work.
Exploring factors of success
Although the prevalence of work-related illness has increased significantly in Scotland since the Fair Work Framework baseline year of 2016, Scotland is second in this measure, with the prevalence of work-related ill health and disease at 4.9% among Scottish workers. Various factors may influence the probability of work-related ill health. A study on the trends and patterns of occupational health and safety in Ireland found that both working long hours, variable working hours, and shift work (particularly working at night) were associated with a higher risk of illness.[111] The report highlighted that inspections decrease the risk of work-related ill health and injury. Furthermore, it is noted that due to the negative effects of challenging work conditions such as long hours and shift hours, it is important for employers and workers to be adequately informed about the trade-offs of different types of working arrangements to help prevent work-related health issues.[112]
For the Government of Ireland, promoting healthy workplaces is one of the key priorities set in the Healthy Ireland Strategic Action Plan 2021-2025.[113] In this context, the Government of Ireland’s Department of Public Health and the Department of Enterprise, Trade and Employment developed the Healthy Workplace Framework,[114] a strategic document outlining the Government’s ambition to promote the social, environmental, and cultural conditions for improved health in Irish workplaces, including improved mental health. Currently, 32% of workplaces in Ireland have a health and wellbeing strategy, 84% have an employee assistance programme, 45% provide mental health support, and 44% offer onsite wellbeing initiatives.[115]
Finally, as discussed in the previous chapter, a significant portion of the increase in work-related ill health in Scotland can be attributed to a dramatic rise in work-related stress, anxiety and depression over the recent years that coincided with the Covid-19 pandemic. Data from the 2019 EU-OSHA, the European Survey of Enterprises on New and Emerging Risks, presented in a Health and Safety Executive report, showed that the United Kingdom is second in terms of the share of establishments with an action plan to prevent work-related stress, ranking higher than fourth placed Ireland.[116]
Source: (i) England and Scotland: Labour Force Survey – Health and Safety Executive Tables, (ii) Comparator countries: Eurostat – European Union Labour Force Survey (EU-LFS)
Security
Gender pay gap
The indicator on the gender pay gap measures the difference between the average gross hourly earnings of all paid male and female employees as a percentage of male average hourly earnings.[118]
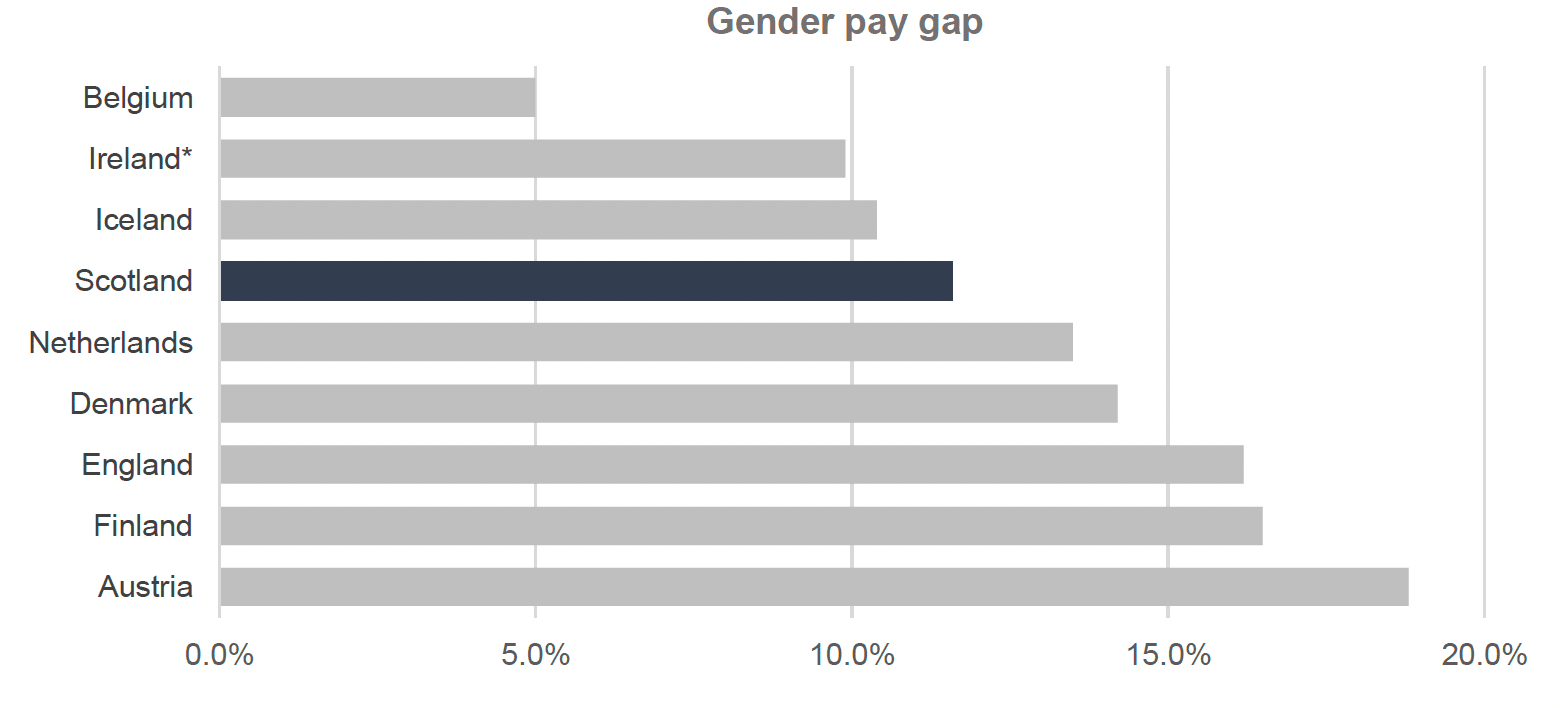
According to Eurostat data, Belgium had the lowest gender pay gap among the countries in the International Framework, at 5.0% for all employees in 2021. Scotland was third in this measure in 2020 and 2021, and ranks fourth overall for this measure among its international comparators. We could not identify data for 2021 for Ireland, therefore Ireland’s 2020 value for the gender pay gap is included in the chart below. Ireland was second among the countries in the International Framework in 2020, and its gender pay gap was 9.9%, and compared to 11.1% in Scotland in that year. Ireland’s 2020 gender pay gap was lower than the value observed in all international comparators in 2021 except for Belgium.
Although the gender pay gap in Scotland was more than double that of Belgium at 11.6% in 2021, Scotland outperformed all countries in the Framework, except for Belgium and Iceland. The widest pay gap among the comparator countries in 2021 was observed in Austria at 18.8%.
Source: (i) England and Scotland: Annual Survey of Hours and Earnings, (ii) Comparator countries: Eurostat – based on the Structure of Earnings Survey (SES) and national sources.
Exploring factors of success
There are many potential reasons for the differences in pay between men and women. In 2021, 60% of the pay gap in Europe could be attributed to motherhood and 40% to discrimination and social stereotypes.[120] Women are also more likely to work part-time than full-time. Low pay is more prevalent among part-time workers than full-time workers in most European countries, including the United Kingdom.[121] In 2021, in Scotland, 38.3% of women in the workforce worked part-time compared to 13.3% of male workers.[122] While the higher number of women working part-time contributes to the gender pay gap, it does not explain the differences between Belgium and Scotland. In Belgium, statistics on the differences in employment structure between men and women were comparable to Scotland in 2021, with 39.5% of women in the workforce working part-time compared to 10.4% of men.[123]
Belgium has the fifth lowest gender pay gap in the European Union.[124] It has many positive labour force characteristics related to the pay gap. Belgian women have very high educational attainment and are better educated than Belgian men, particularly among the newer generations. In 2010, 49% of women aged between 25 to 34 years old had a tertiary degree compared to 36% of men of the same age.[125] Over the following period, between 2012 to 2021, the indicator for the gender pay gap showed considerable improvement, narrowing from 8.3% in 2012 to 5% in 2021.[126]
The Scottish Government recently published a comprehensive report on international examples of mechanisms to revalue women’s work, which included a discussion of actions taken in Belgium to support equal pay.[127] In Belgium, gender equality in work terms and conditions is upheld by the 2007 Gender Act and supported by schemes to promote gender-neutral job evaluation schemes, to eliminate the potential for gender bias in worker evaluation by their employers. The Institute for Equality between Women and Men, an autonomous federal public institution founded in 2002, is responsible for promoting gender equality and combating gender discrimination and leads efforts for gender mainstreaming.[128] Furthermore, to address the gender pay gap, additional legislation was introduced in 2012 in the Pay Gap Law of 22 April 2012, requiring firms to submit extensive documentation relating to the remuneration of their employees to ensure that remuneration policies are gender-neutral.[129] Additionally, the 2012 Pay Gap Law gave power to the Committee on Prevention and Protection at Work, where necessary, to request enterprises generate an action plan for gender neutrality with a mediator's support and protect employees who have reported unfair treatment.[130] According to the 2021 International Mechanisms to Revalue Women’s Work report, there have been proposals to make these action plans compulsory in the event of unequal remuneration.[131]
In the United Kingdom, equal pay is a legal requirement and is currently part of the Equality Act 2010.[132] However, a gender pay gap still persists across the labour market and within organisations. The UK Government requires all public and private sector organisations in England, Scotland and Wales that have more than 250 staff to report gender pay gap figures annually. Additionally, the UK government recommends a range of optional actions, such as organisations publishing a supporting narrative statement that explores the reasons behind the gender pay gap and an Action Plan for reducing the gap.[133] The Government Equalities Office has published guidance for organisations wishing to develop a gender pay gap action plan. However, developing such an action plan is not mandatory, and there is no further assistance from government to businesses who opt to develop an action plan.[134]
The Scottish Government does not have the legislative power to pass similarly binding legislation in Scotland. However, the Scottish Government is taking steps to combat gender inequalities in the workplace, including the gender pay gap. Steps include improving the information available about the employment rights of working pregnant women to ensure safe work environments, (ii) projects such as Equate Scotland and Lose the Gap to support the recruitment of women in sectors and occupations where they are underrepresented and improve employment practices around gender equality and pay.[135] The Scottish Government also outlined a set of policy measures to tackle the gender pay gap in the Scottish Government’s 2019 Gender Pay Gap Action Plan.[136] This, among other measures, includes (i) expanding funding for the Workplace Equality Fund, (ii) conducting more research on issues faced by women in the workplace and how the pay gap can be narrowed, (iii) working with employers to promote gender pay gap action plans in the private sector, as well as (iv) pressing the UK Government to introduce more binding legislation, including requiring businesses to publish a gender pay gap action plan, and protecting women against discrimination. Additionally, the Scottish Business Pledge includes taking action to address the gender pay gap as one of the ten actions recommended to businesses joining the partnership.[137] Actions required for businesses joining the pledge include expectations that all businesses, regardless of size, collect data on workforce composition and commit to identifying gender pay gaps, as well as produce an action plan to address their gender pay gap within specific timeframes.[138]
The 2021 International Mechanisms to Revalue Women’s Work report proposes a wide range of actions that can be taken within the limits of current devolved powers. These include supporting the improvement of job evaluation practices, gender pay gap reporting, and supporting collective bargaining, as well as implementing the Fair Work Convention’s recommendations to develop minimum contract standards for publicly funded social care services, such as restricting the practice of zero hours contracts.
Permanent employment
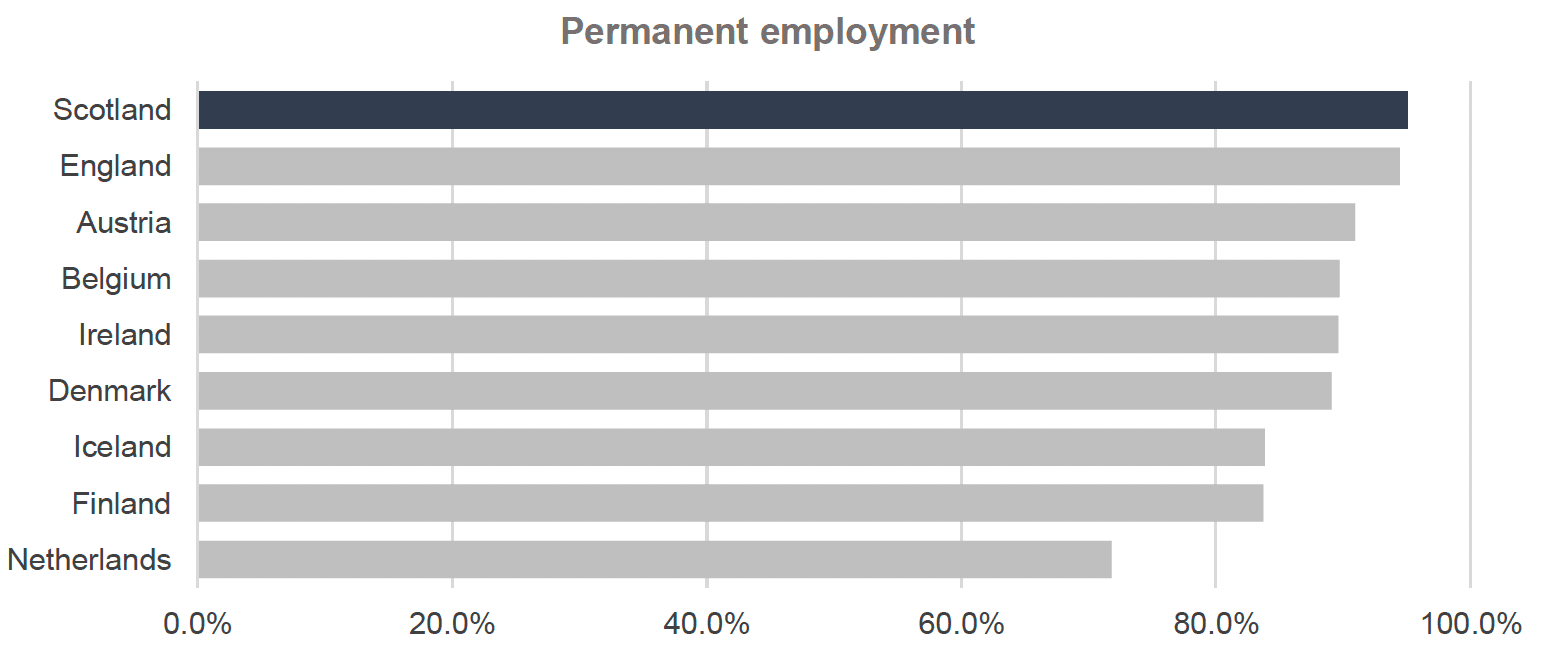
Scotland is leading in the sub-measure of the share of workers employed in permanent contracts, with 95% of workers having a permanent contract. Scotland is followed by England (94.4%). For most countries in the International Framework, i.e., Austria, Belgium, Ireland, Denmark, Iceland and Finland, the value of this indicator is between 83.7%-91%, a difference of less than eight percentage points. As shown in Figure 14 below, the Netherlands has the lowest share of workers with a permanent contract, at 71.8% of the workforce.
Source: (i) Scotland and England: Annual Population Survey, (ii) Comparator countries: International Labour Organisation - ILOSTAT, Labour Force Statistics (LFS)
Involuntary work type and underemployment
In the next two indicators, involuntary non-permanent and involuntary part-time work, “involuntary” refers to “not-preferred choice”. A worker is classified as being in involuntary part-time work if they would prefer to work under a different work arrangement, e.g. full-time work. Similarly for temporary workers, if they would prefer to work under a permanent contract. Flexible work arrangements such as temporary work or part-time work may not be problematic, however, workers may feel ‘pushed’ to accept a less preferred employment arrangement to avoid unemployment.[139] This incidence is captured by the indicators of involuntary non-permanent work and involuntary part-time work. On the other hand, the indicator on underemployment captures the proportion of workers who reported that they would like to work more hours than they are working presently.
According to a 2022 study, work-type and contract-type preferences of workers have been found to be tremendously impactful on the job satisfaction of workers in Europe.[140] The same study, using data from 2017 from 24 European countries, found that involuntary temporary workers had lower job satisfaction than voluntary temporary workers. Voluntary temporary workers had a similar or higher level of job satisfaction than permanent workers in all but two countries in the study: Bulgaria and the Netherlands.
Involuntary non-permanent work
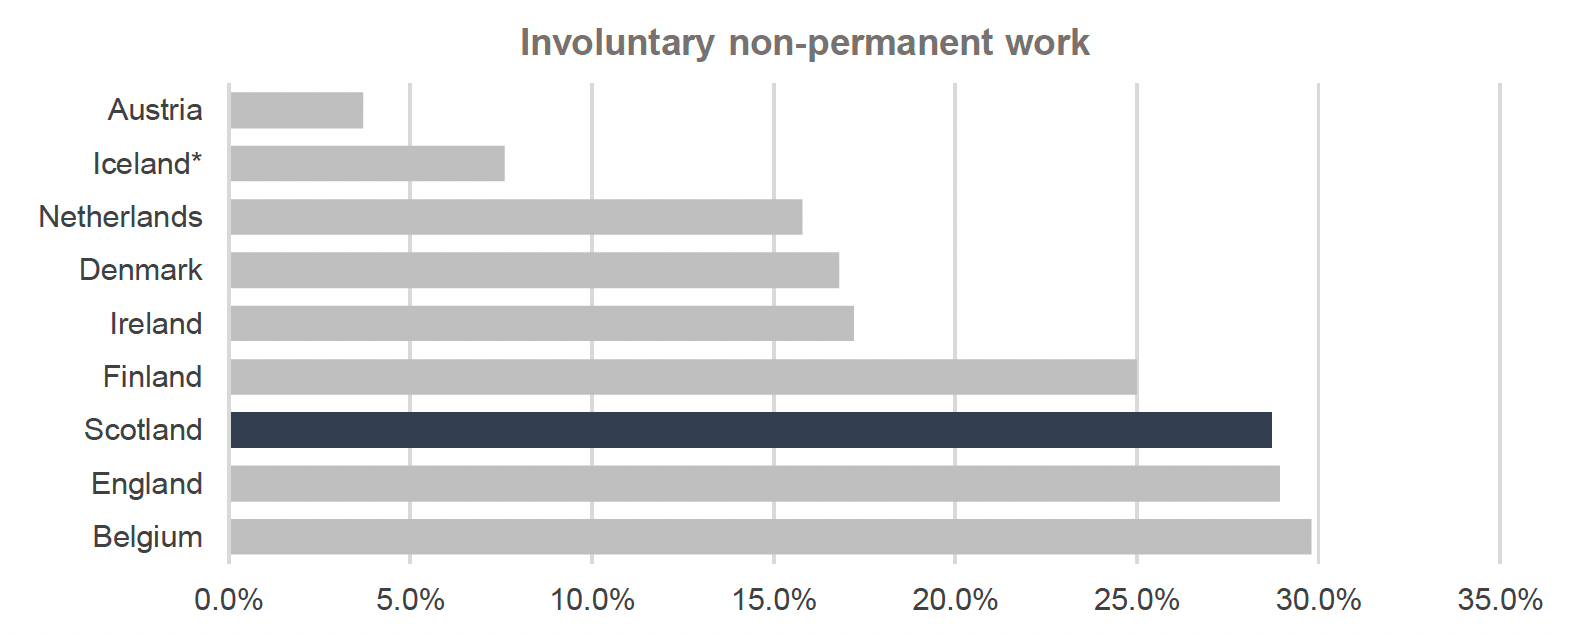
In 2021, in Austria, among workers in temporary employment, 3.7% are considered involuntary non-permanent workers, as they report working in non-permanent work due to being unable to find a permanent job. Austria is leading the International Framework, while the Netherlands (15.8%) and Denmark (16.8%) have the second and third best performance in 2021. The Netherlands is also the country with the highest share of workers in non-permanent jobs (both voluntary and involuntary) among those in the International Framework, thus its overall good performance in this indicator suggests the high portion of temporary workers is not a product of a shortage of permanent job vacancies.
In 2021, Scotland ranked sixth out of eight countries in the International Framework in this measure. Almost one out of every three (28.7%) temporary workers in Scotland, work in non-permanent jobs because they could not find permanent employment. In 2021, Scotland only outperformed England and Belgium, surpassing Belgium by 1.1 percentage points, compared to the 25 percentage points difference with Austria’s measure. Data was not available for the percentage of workers in involuntary non-permanent work for Iceland in 2021, however the latest data available for this measure in Iceland from 2019 places Iceland second among the countries in the International Framework. Scotland ranks seventh out of the nine countries in the International Framework when considering Iceland’s 2019 value for the involuntary non-permanent work indicator.
Source: (i) Scotland and England: Annual Population Survey, (ii) Comparator countries: Eurostat – European Union Labour Force Survey (EU-LFS)
Exploring factors of success
Many factors may determine the proportion of involuntary non-permanent workers, and it would not be possible to identify all of them. Austria's temporary worker population, and the type of temporary work, vary significantly from the United Kingdom’s. For example, in 2017, a larger share of temporary workers was working on temporary contracts due to being in a probationary period for a permanent position in Austria (12.2%) than in the United Kingdom (3.2%).[142] Furthermore, in 2017, 43.1% of Austrian temporary workers were in education or training compared to 9% in the United Kingdom. Moreover, in Austria, temporary contracts are likely to be longer than in the United Kingdom. In 2017, almost one out of two temporary contracts in Austria (48.9%) lasted longer than 13 months, and 39.7% lasted over two years. By comparison, in the United Kingdom, in 2017, 22.7% of temporary contracts had a length of over 13 months and only 10.4% over two years.[143] Overall, these statistics imply that temporary work in Austria can be less precarious than in the United Kingdom, especially for workers with longer temporary contracts.
Underemployment and involuntary part-time work
Regarding the indicator for underemployment, in 2021, Austria recorded the best performance among the countries in the International Framework, as 3.5% of workers reported they were willing and available to work additional hours compared to their current hours. Denmark and Iceland performed similarly well to Austria, recording 3.8% and 3.9% in this indicator respectively. Although outperforming the United Kingdom's average of 7.18%, Scotland was sixth among the countries in the International Framework, with 6.3% of workers wanting to work additional hours, with a larger share of workers reporting being underemployed only in Finland, the Netherlands, and England.
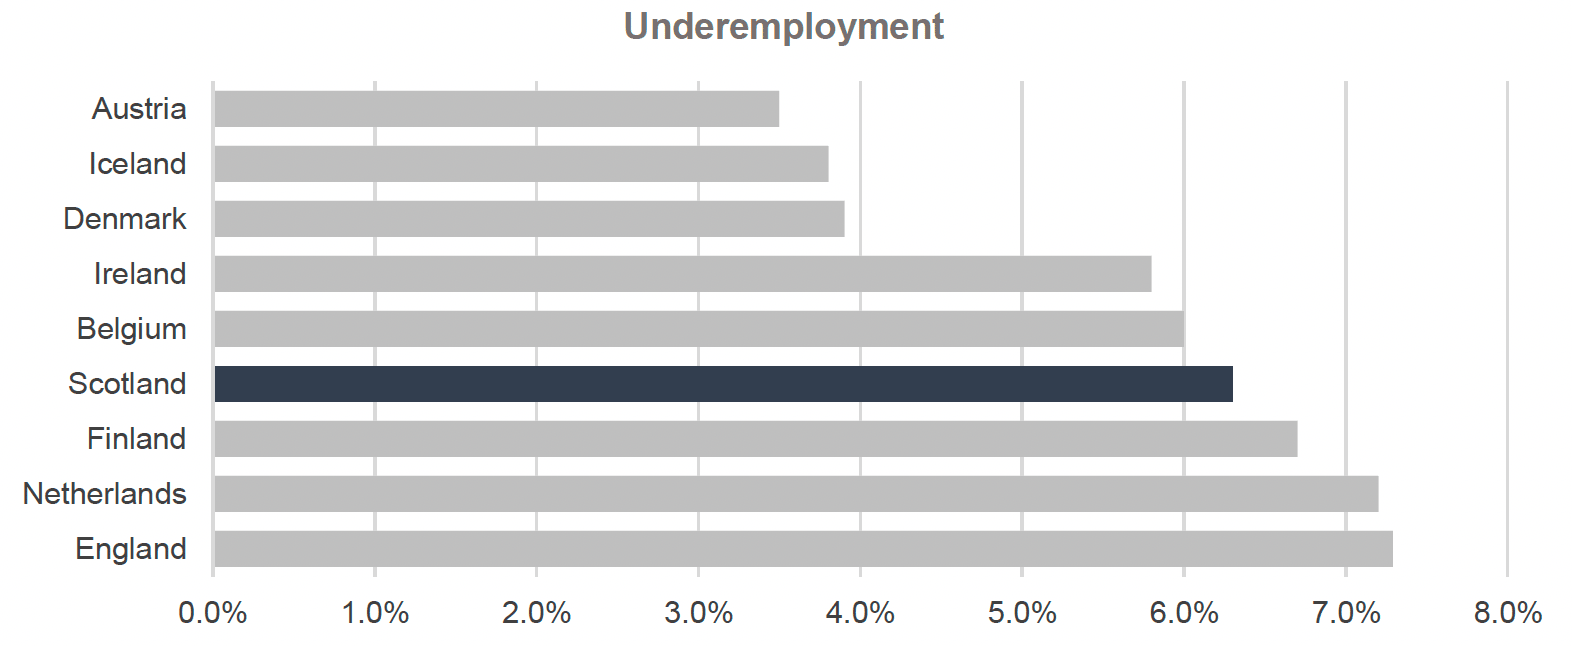
Source: (i) Scotland and England: Annual Population Survey, (ii) Comparator countries: International Labour Organisation - ILOSTAT, Labour Force Statistics (LFS)
A different measure that is commonly used to assess underemployment is the percentage of involuntary part-time workers.[144] In 2021, the Netherlands recorded the most favourable performance in the indicator for involuntary part-time work, as only 3.7% of people who work part-time reported that the reason for working part-time was that they could not find full-time employment. This was followed by Austria, where this indicator was at 9.2% in 2021, and Denmark at 9.3% in 2021. Scotland is in sixth place among the countries in the Framework, with a better figure than Finland, Belgium and Iceland and a worse figure than the Netherlands, Austria, Denmark, England, and Ireland. In this indicator, the gap to the leading performance is significantly wider than the indicator for underemployment at 10 percentage points. The Netherlands also had the highest part-time employment rate in Europe in 2019, at 50.2%. Although the gap to the leading country is relatively steep, the gap to the second placed Austria’s figure is lower at 4.5 percentage points.
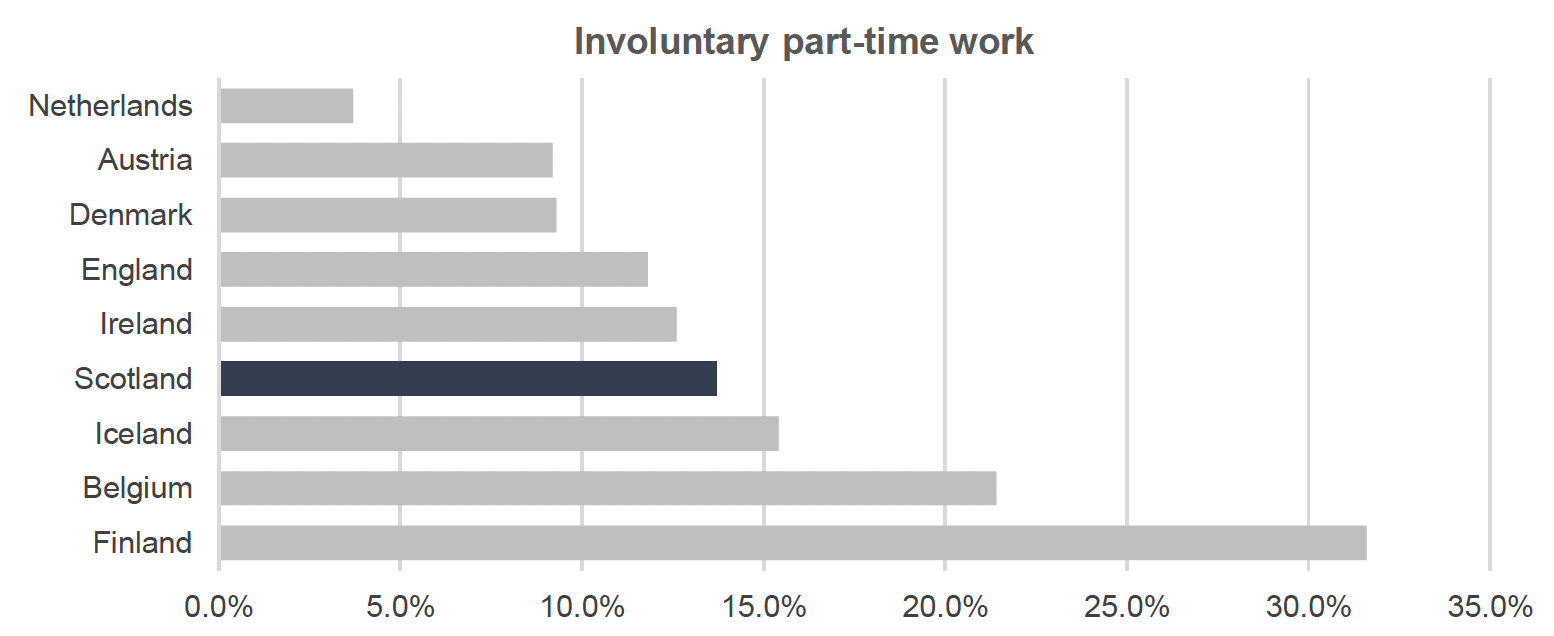
Source: (i) Scotland and England: Annual Population Survey, (ii) Comparator countries: Eurostat – European Union Labour Force Survey (EU-LFS)
Exploring factors of success
Since the start of the economic crisis in Europe, there has been an increase in part-time employment in Europe.[145] The Netherlands is a particularly interesting case in terms of this indicator. Across the European Union and the United Kingdom, involuntary part-time work has increased over the last few years, rising from 22.4% in 2007 to 23.6% in 2019. Over the same period, part-time employment has soared in the Netherlands, which had the highest part-time employment rate in Europe in 2019, at 50.2%.[146] Indeed, a study of the Dutch labour market notes that new contract arrangements have allowed increasing opportunities for workers to access flexible and part-time work from 2001 to 2016.[147] Although part-time employment has been very high in the Netherlands and despite the general increasing trend in involuntary part-time work in Europe, involuntary part-time work in the Netherlands decreased from 5.3% in 2019 to 3.7% in 2021.
Apart from job loss due to the crisis, the academic literature suggests that a higher incidence of involuntary part-time work coincided with a long-term employment substitution due to technological advances affecting medium and low skilled workers and the loss of jobs due to the economic crisis in Europe.[148] Automation and new technologies have particularly affected middle-skilled workers in Western economies, forcing many to seek low skilled employment. This, in turn, is theorised to lead to higher competition at the lower-skilled end of the labour market and increases involuntary part-time employment among lower-skilled workers. Training and job creation schemes can mitigate the effects of this movement in the labour market. Research on the incidence of involuntary part-time work, and the effectiveness of various policies as a mitigating factor, found that job creation schemes could be associated with decreased involuntary part-time work.[149]
Low pay
The indicator on low pay captures the portion of full-time workers who earn less than two-thirds of median hourly earnings. Due to data unavailability for some countries in the International Framework in 2019, we present findings on this sub-measure for both 2018 and 2019. Furthermore, data for this measure was not available for Scotland, hence we used data for the United Kingdom.
In both years, the Netherlands had the lowest share of full-time workers earning less than two-thirds of median earnings in the country, with this share being 6.4% in 2018 and 6.5% in 2019. The United Kingdom was third among the countries in the International Framework in terms of low pay in 2019 and fifth in 2018, with the percentage of full-time workers earning less than two-thirds of the median wage being 9.6% and 10.3% respectively. It is important to note that it is difficult to assess the United Kingdom’s relative performance, as for 2019, there was no data available for Iceland and Denmark, while the United Kingdom performed worse in this indicator in 2018, being fifth among the compared countries, as can be seen in Figure 18. No data is available to allow comparisons for low pay after 2019.
When comparing all countries in the International Framework, using the latest value available for low pay across both 2018 and 2019, the United Kingdom ranks fifth, behind the Netherlands, Iceland, Finland, and Denmark.
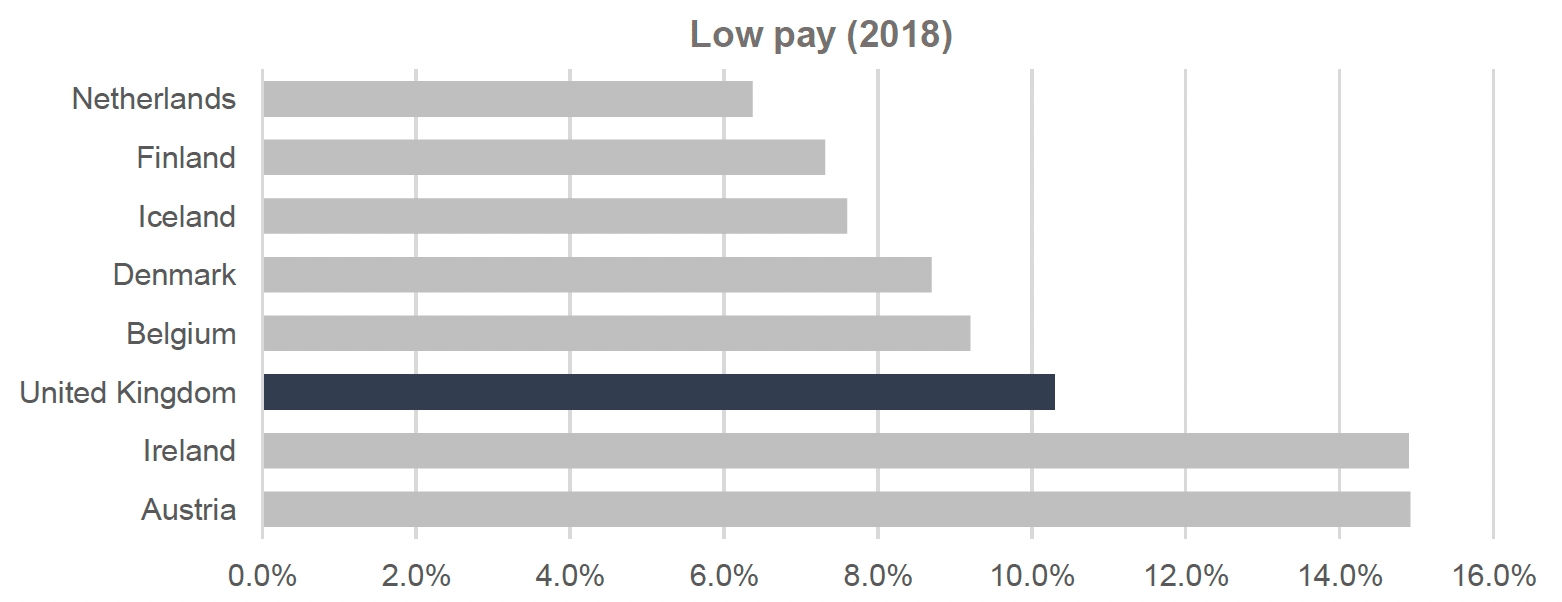
Source: (i) Scotland and United Kingdom: Office for National Statistics using data from the Annual Survey of Hours and Earnings, (ii) Comparator countries: OECD data
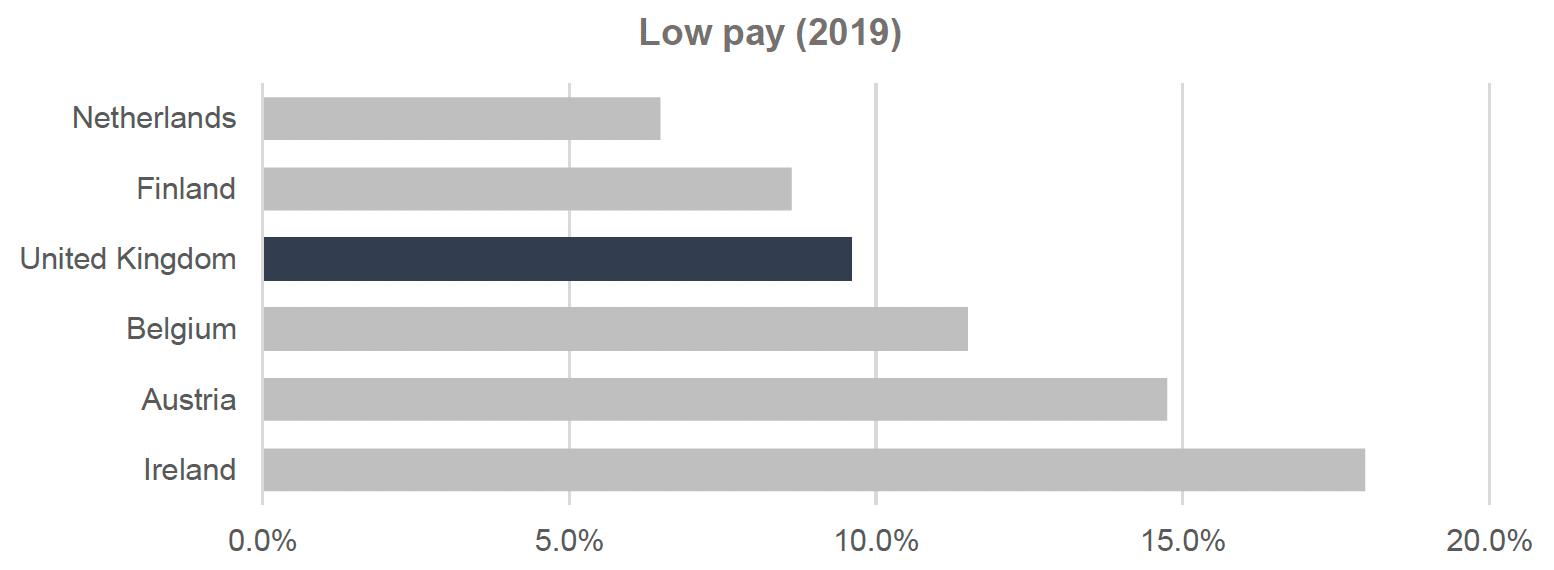
Source: (i) Scotland and United Kingdom: Office for National Statistics, using data from the Annual Survey of Hours and Earnings, (ii) Comparator countries: OECD data
Challenges in international comparisons
It is challenging to accurately assess the true performance of the United Kingdom compared to other countries related to low pay. The indicator for low pay published by the OECD and used in the International Framework only refers to full-time workers. However, part-time workers account for a large share of lower paid workers in the Netherlands and among many other northern European countries such as Austria and Belgium.[150] This is also the case in the United Kingdom, where in 2019, 32.9% of part-time workers were low paid compared to 9.6% of full-time workers.[151]
In 2019 the Netherlands had the largest part-time employment as a share of total employment at 50.2%. For reference, in Finland, the second-best performing country in the Framework for low pay in both 2018 and 2019, only 15.5% of employees were part-time workers in 2019; this figure was 24.4% for the United Kingdom in the same year.[152]
The findings are mixed when comparing the United Kingdom to countries in the International Framework with similar shares of full-time work, such as Belgium and Denmark (75.1% and 75.8% respectively). The United Kingdom had a higher share of lower paid full-time workers than both Belgium and Denmark in 2018 but a lower share of low paid full-time workers than Belgium in 2019, while data from 2019 are not available for Denmark.[153] However, we have no indication as to whether performance across all employees would be similar between these countries as we have no information on the similarities or differences in the distribution of skills between part-time and full-time workers in these countries.
For Scotland, data on low pay is only available across all employees (both full-time and part-time), hence not allowing for direct comparisons with other countries in the International Framework. The percentage of all employees’ earnings less than two-thirds of median hourly earnings in Scotland was 16% in 2018[154] and 14.5% in 2019.[155] For reference, the UK average across both full-time and part-time employees was 17.8% in 2018 and 16.2% in 2019. Scotland had a similar share of part-time workers (26.5%)[156] to the United Kingdom (24.4%)[157] in 2019.
Overall, the relative performance in low pay between the countries included in the International Framework is unclear. It is difficult to assess the United Kingdom’s overall performance against the selected comparator countries, as the indicator for which there is available data focuses only on full-time workers. Depending on variations in the share of full-time and part-time workers across countries in the International Framework, their relative performance could be very different if we also considered part-time workers. Furthermore, data on this indicator is missing for Scotland.
Hence, we cannot conclude how Scotland would compare with the countries in the International Framework and what elements of the labour market structure and institutions may support leading performance in low pay. If data becomes available in the future, a part-time adjusted measure of low pay could offer a complete overview of low pay across the countries in the International Framework, and Scotland, considering the aforementioned variations in employment structure across Europe.
Exploring factors affecting low pay
Low pay is often driven by a number of different factors, including lower productivity and skill levels of workers, skills that are in low demand, excess labour supply, as well as language barriers, discrimination in the labour market, and unequal opportunities for people with protected characteristics such as people with a disability.[158] Apart from worker characteristics, low pay cross-country variations can be influenced, as mentioned above, by factors related to the structure of the labour market, such as the share of temporary and part-time workers and the types of occupations and industries prevalent in each economy. Finally, as discussed in an Evidence Review on low-pay and in-work poverty conducted by the London School of Economics and Political Sciences (LSE) for the European Commission, a share of low paid workers can be ‘trapped’ in long-term low pay, particularly those in less secure jobs, who are hence more likely to become unemployed.[159]
The aforementioned evidence review suggests that policies in the following areas are required to combat low pay and to help low paid workers progress to higher paid jobs:
- Education and skills policies: Higher skills are associated with a lower incidence of low pay. However, as will also be discussed in the following section, a key challenge is often skills underutilisation, with qualified workers often struggling to find employment matching their skills.
- Active labour market policy: Particularly education and training programmes, as well as job activation programmes.
- Tax and benefits: Including in-work benefits that can boost low paid workers’ incomes and provision of incentives to employers to create new partly-subsidised jobs.
- Policies addressing labour supply constraints: These can include a range of constraints such as health, caring responsibilities, and long commutes. Policies that can help address these constraints can include: (i) offering high quality childcare, (ii) policies to improve the work opportunities available to those working part-time or in flexible contracts, (iii) improvements in public transport, particularly from areas with limited local job opportunities.[160]
Fulfilment
Skills underutilisation – Overqualification
OECD data on skills mismatch and overqualification shows that Finland is the leading country among those in the International Framework in terms of having the smallest share of the workforce being overqualified for their current job, as this figure was at 8% in 2019. Finland is followed by Ireland and Belgium, both of which had a figure of 11% in 2019. Data drawn from the Working Lives Scotland survey (WLS) indicates that Scotland is significantly far from the leading countries’ performance, ranking last among the countries in the International Framework, with 29% of workers reporting being overqualified for their current job.[161]
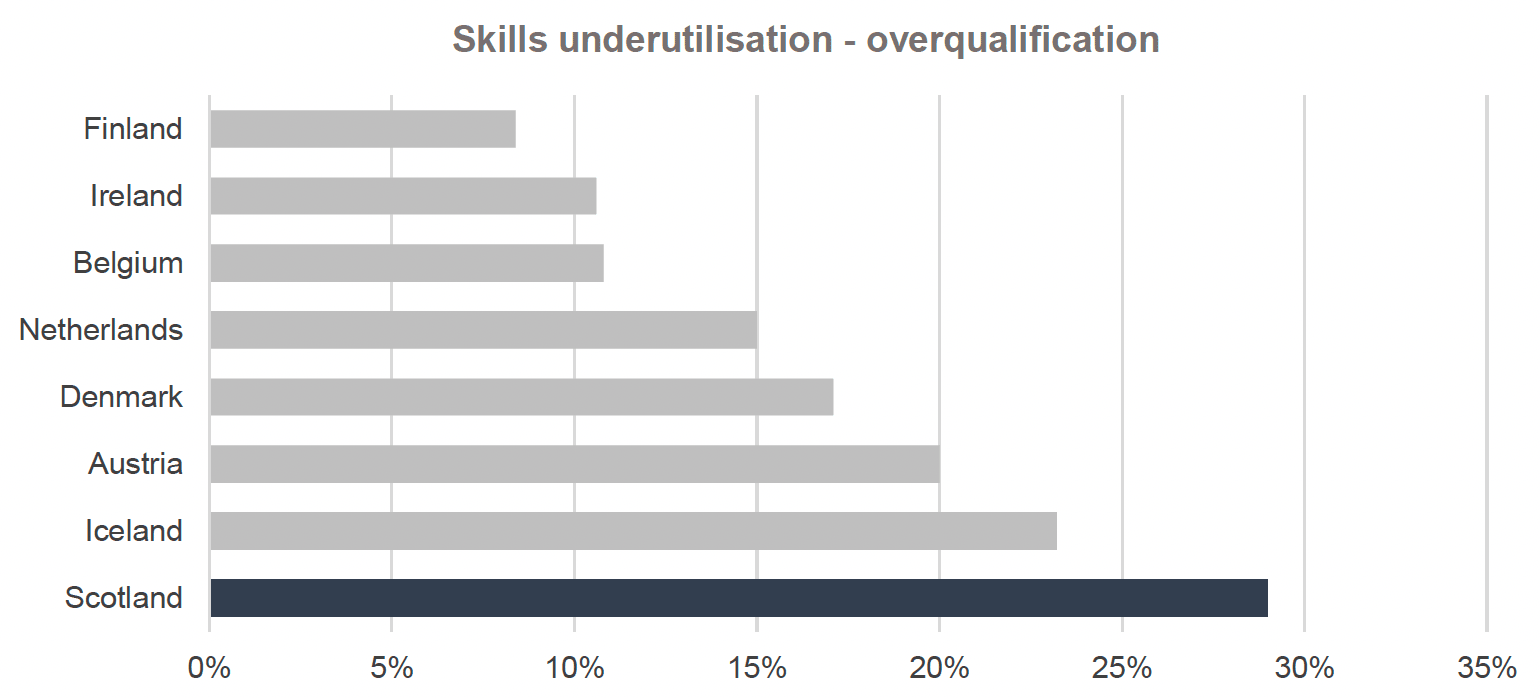
Source: (i) Scotland: Working Lives Scotland survey,[163] (ii) United Kingdom: UK Working Lives Survey, (iii) Comparator Countries: OECD data
Note: Data for Scotland is for 2020, while for the rest of the countries, data is for 2019.
The indicator definitions and sampling methods used in different data sources may vary significantly. The OECD indicator on overqualification draws from EU-LFS data and is defined as the percentage of employees who report holding a qualification that is higher than required for their job description. The WLS survey indicator is defined as the percentage of workers who report they are overqualified for their current job.
Exploring factors of success
A 2017 study found that skills underutilisation represents a loss of between £12bn and £25bn to the United Kingdom’s economy.[164] Underutilisation was highest in the following sectors: (i) distribution, hotels & restaurants, (ii) transport and communication, and (iii) manufacturing. The same study finds that in the UK, skill underutilisation is highest among workers earning lower wages.
Discrimination can also impact skills underutilisation. According to a study using 2010 and 2015 European Working Conditions Surveys (EWCS) data from 30 European countries, skills underutilisation is higher among workers who report experiencing discrimination due to their ethnic or racial background and/or sex.[165]
Data from the European Skills and Jobs Survey suggests that over-education and over-skilling workers are a key challenge in European economies and the United Kingdom.[166] Additionally, there is often significant co-incidence of the two factors, as in 2014, 44% of European workers who reported being over-educated for their job also said that they were over-skilled.[167]
Overall, research suggests that often policies aiming at addressing skills mismatches emphasise initiatives to improve the responsiveness of training and education systems to skills needs, to ensure the future workforce is equipped with the skills that will be required in the future.[168] Thus, such policies combat skill shortages and skills gaps when overqualification and surplus human capital pose a more significant challenge to the European workforce and impose a significant cost of foregone benefits to the affected countries’ economies.[169]
Effective Voice
Important to note that indicators currently included in the Framework only capture worker voice through labour union organisations. Ideally, and as noted above, we would want a more thorough picture, capturing the ability of individual workers to negotiate their work arrangements and pay. This is a key area for future research.
It is also important to highlight that, in Scotland, labour law is reserved to the UK government.[170] In the UK, collective agreements between employers and workers are voluntary for each employer, and employers may choose not to recognise a trade union.[171]
Trade Union membership
Trade union membership levels vary greatly among the countries in the International Fair Work Nation Framework. The proportion of the workforce that is part of a trade union is the highest in Iceland, where more than nine out of every ten workers or 91.4%, were members of a trade union or staff association in 2019. Denmark follows next, with 67% of workers in a trade union or staff association in 2019. This figure is the lowest in the Netherlands and in England, where only 15.4% and 22.1% of workers are members of a trade union respectively. Overall, the Nordic countries included in the Framework hold the three top positions in this measure, with Iceland first (91.4%), Denmark second (67.0%), and Finland third (58.8%).
Scotland’s trade union membership percentage was 5th among the nine countries in the International Framework, at 29.3%. Finland and Belgium had higher trade union membership than Scotland, while Austria and Ireland had a lower percentage of trade union members among workers.
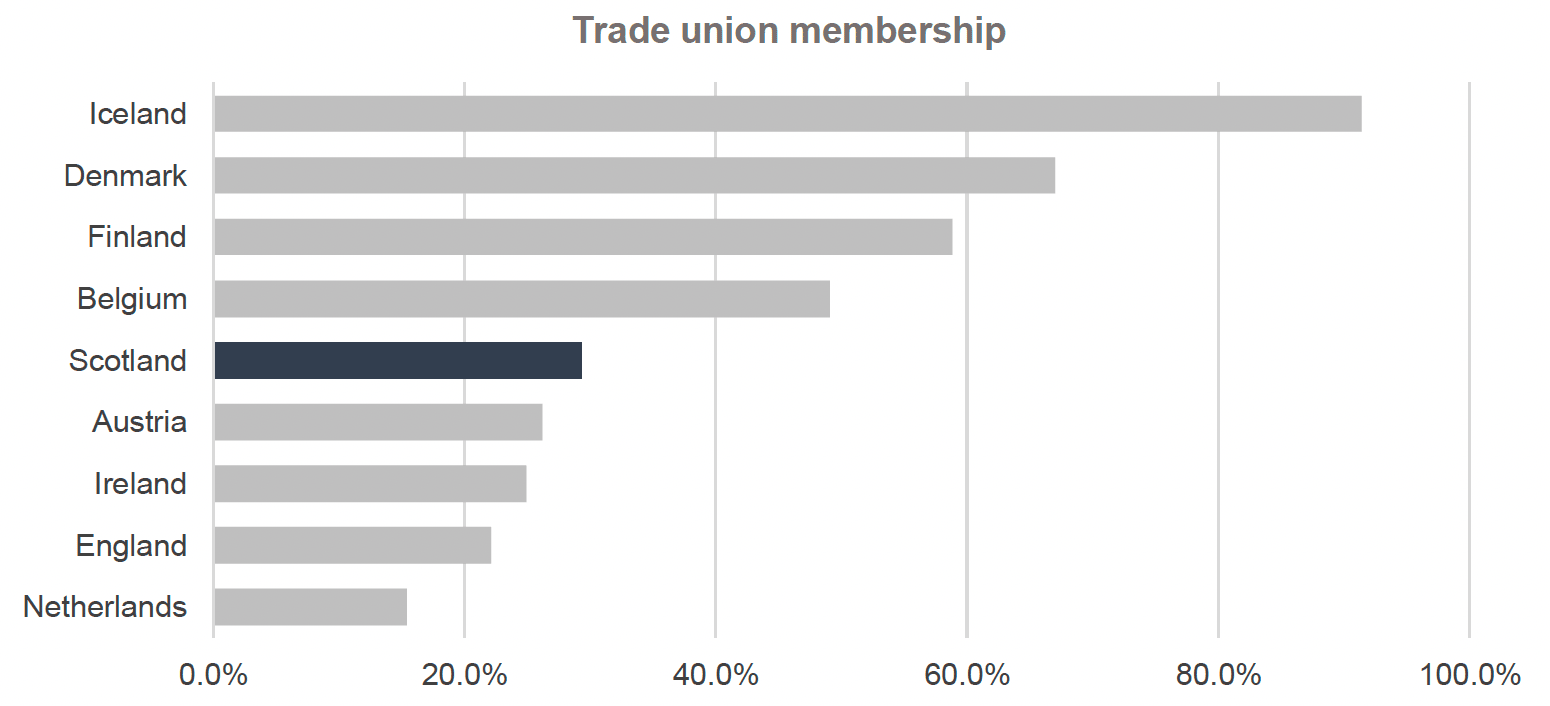
Source: (i) Scotland, and England: Trade Union Statistics (LFS), (ii) Comparator Countries: International Labour Organisation – ILOSTAT Industrial Relations Data (IRdata)
Exploring factors of success
Trade Union membership has been on a declining trend in Europe since 2000. According to a study on trade union membership in Europe, the total number of trade union members dropped from 40.2 million to 36.1 million in 20 European countries between 2000 and 2017.[172] The same study finds that the trade union membership as a percentage of the population average values were lower in the period 2010 to 2017 than in the period 2000 to 2009 in 24 out of 32 countries included in the study. Out of the countries in the International Framework, only Belgium and Iceland had an increase in the 10-year average rate of trade union membership. Iceland recorded the highest increase in trade union membership among 32 European countries, rising by 10.9 percentage points in that period. The average annual rate of trade union membership decreased by 8.5 percentage points in the UK from the period between 2000 to 2009 to the period between 2010 to 2017.
As noted earlier, Iceland, Denmark, Finland, and Belgium were the countries outperforming Scotland in terms of the share of workers who were part of a trade union in 2019. In Iceland, Denmark, and Finland, workers have considerable incentives to be members of trade unions, as trade unions are an integral institution of the labour market, playing a key role in the distribution of unemployment insurance. Participation in a trade union offers membership to the voluntary unemployment insurance system through union-affiliated unemployment insurance funds that are subsidised by the state to distribute unemployment benefits.[173] The size of the unemployment benefit paid may depend on previous worker earnings on top of the basic unemployment benefit. Belgium follows a similar system; however, unemployment insurance is compulsory, and trade unions are involved in distributing only parts of state-funded unemployment benefits. Additionally, in countries with this system, unions are typically highly involved in helping unemployed people back into employment.[174] Thus, in countries following this system, also referred to as the ‘Ghent system’, workers who feel at risk of losing their job have a significant incentive to be part of a trade union.[175]
Since this system’s implementation in different countries, policies have varied. In some cases, such as Sweden, the prevalence of a Ghent system has declined significantly. Additionally, in Denmark, over the last decade, new independent Unemployment Insurance Funds have formed, not associated with or controlled by Trade Unions, as was normally the case previously.[176] However, the historic presence of the Ghent system in the Nordic countries, and Belgium, could potentially explain part of the difference in trade union membership compared to other countries in the International Framework.
In the United Kingdom, the distribution of Universal Credit is a power reserved to the UK Government, and thus not a policy lever the devolved Scottish Government can control. Among the countries in the International Framework that do not operate a “Ghent system” policy scheme, Scotland performed better in terms of trade union membership in 2019, with a higher share of workers who are members of a trade union than Austria, Ireland, England, and the Netherlands.
Collective bargaining
Although Austria is 6th in terms of the percentage of workers who are members of a trade union, in 2019, it had the highest share of workers whose pay and working arrangements are affected by collective bargaining at 98%. Belgium and Iceland also performed very favourably, with figures of over 90%, while in Iceland, the share of workers affected by collective agreements was 75.6% in 2019. Scotland and England are the worst performing countries in the International Framework in 2019 for this sub-measure at 38.1% and 24.8% respectively.[177]
We could not identify data for this indicator for 2019 for Denmark, Finland, and Ireland. In 2018, the value of this indicator was significantly higher in both Finland (89.2%) and Denmark (80.3%) than in Scotland in the same year (36.2%). In 2017, the share of workers in Ireland covered by collective agreements was comparable to Scotland’s, as collective bargaining coverage was at 34% in Ireland,[178] and 34.7% in Scotland in the same year.
It is important to note that data sources may vary for different countries in the International Framework. The source of this statistic for Scotland and England is the Labour Force Survey (LFS), which is a survey of individuals. Very often, workers may not be aware that their working arrangements are influenced by collective agreements, especially if they themselves are not a member of a trade union or staff association. In other countries, figures on collective bargaining coverage are drawn from administrative data sources. As a result, the actual gaps in collective bargaining may be different. For instance, a different UK survey, the Annual Survey of Hours and Earnings (ASHE), which is responded by employers, reports a higher UK share of workers affected by collective bargaining than the LFS, at 39.2% for the entire UK, and 51.6% for Scotland in 2019.[179] In any case, all data suggested that in 2019 Scotland was trailing significantly compared to the first three leading countries, and particularly Austria.
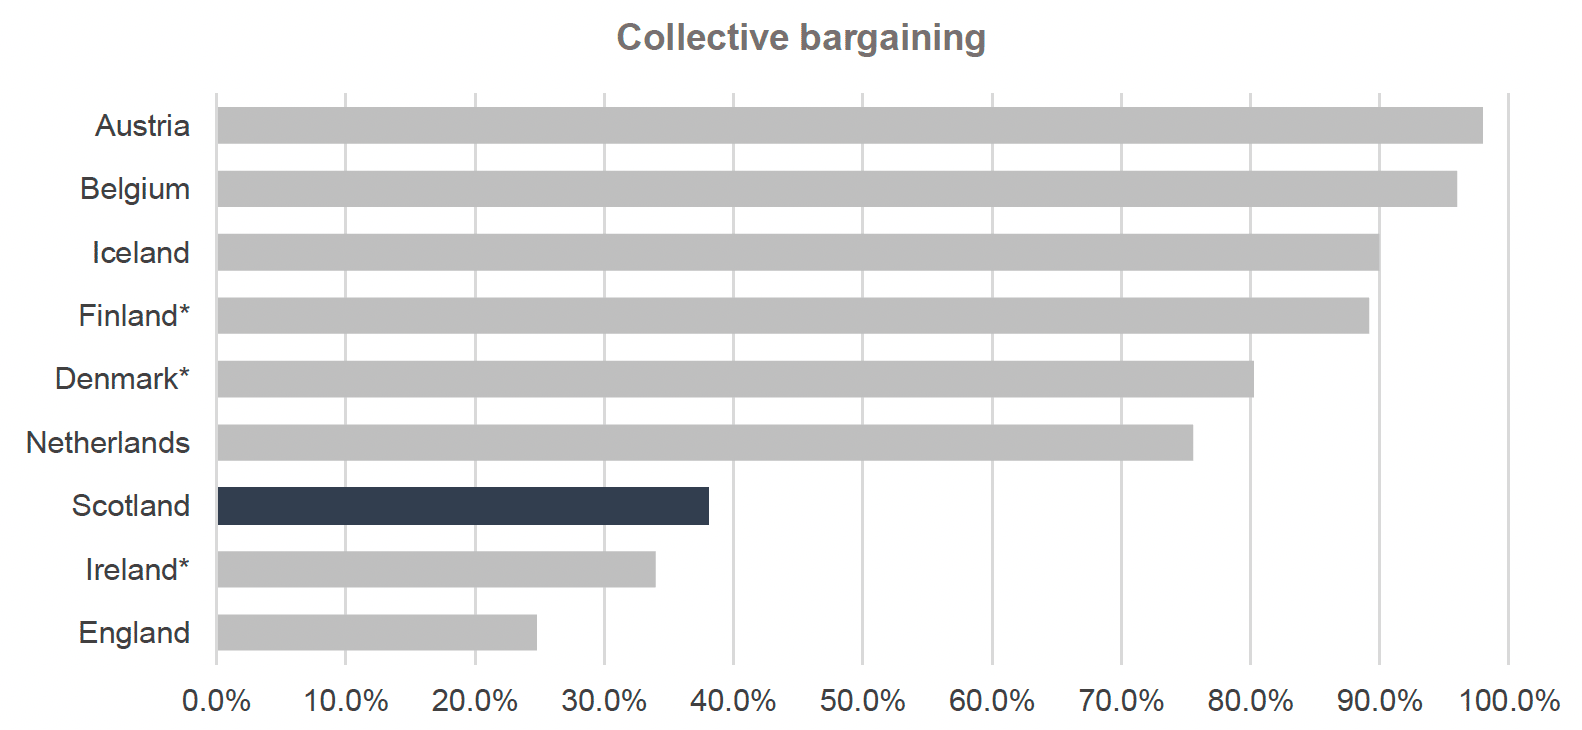
Source: (i) England and Scotland: Trade Union Statistics – LFS, and Annual Survey of Hours and Earnings, (ii) Comparator Countries: International Labour Organisation – ILOSTAT Industrial Relations Data (IRdata), and OECD data.
Exploring factors of success
Collective bargaining has a critical role in the Austrian labour market as labour conditions depend on collective agreements' outcomes. For example, there is no statutory minimum wage in Austria, but the official minimum wage is a collective agreement between workers and employers. As such collective agreements are highly institutionalised: after representatives of workers and employers negotiate, a collective agreement is put in effect by statutory interest groups such as the Chambers of Labours, the Austrian Economic Chamber, the chambers of the liberal professions, trade unions, and employers' associations, or via legislation. Once a collective agreement is reached, it has a statutory effect and thus applies to all workers in the affected sector.[182] Collective agreements regarding minimum wage in Austria may vary by sector.[183] The significant institutionalisation of collective agreements can explain both the disparity between the share of workers who are part of a trade union in Austria and the share of workers who are affected by collective bargaining, as well as Austria’s leading performance in this measure.
Similarly to Austria, in Belgium, national collective agreements are sanctioned by the State, and apply to the whole private sector, while conditions on specific sectors are ordained by Sectorial collective agreements.[184] According to Belgian law, the scope for individual negotiations between employers and employees is only to improve the conditions set in national or sectorial collective agreements.[185] Finally, in Iceland, collective agreements also apply to all workers in a sector.[186]
While the share of workers in Scotland affected by collective agreements is higher than the proportion of the workforce being a trade union member, it is still lower compared to other countries where collective agreements are legally upheld and enforced by legislation. Promoting collective bargaining is a key commitment of the 2022 and 2021 Fair Work Action Plans, particularly in the social care, early years and childcare, hospitality and construction sectors.[187],[188] In this area of interest, the International Framework cannot offer any valuable insights on Scotland’s relative performance or steps for improvement, as the policy landscape relating to collective bargaining is very different in the United Kingdom compared to other countries measured in the International Framework.