3 Results from the survey of workers
This chapter details the key findings from the survey of workers with sections describing the demographic and employment profile of those working in the sector, contractual arrangements, pay, hours, training, working relationships and employee voice.
3.1 Demographic and employment profile
Overall, 245 hospitality workers responded to the survey. The following section provides details on the profile of these workers including key demographics and details of their employment.
3.1.1 Key demographics
Table 2 illustrates the percentage of survey respondents in a number of key groups of interest and, for comparison, the percentages of these groups within the whole sector workforce.
The survey sample profile is broadly representative in terms of percentage of women, non-UK nationals, ethnic minorities and rural residents. However, the survey under-represents workers aged 16 to 24 (21% of survey respondents vs 38% of total workers in sector) and zero-hour contract workers (19% vs 28%) but over-represents people with a disability (32% vs 14%).
| Profile of workers responding to survey | Profile of those in employment in the accommodation and food services sector* | |
|---|---|---|
| Female (16+) | 51% | 55% |
| Aged 16-24 | 21% | 38% |
| Non-UK Nationals (16+) | 20% | 19% |
| Rural (16+)^ | 22% | 16% |
| With Disability (16-64) | 32% | 14% |
| Ethnic Minority (16+) | 8% | 12% |
| Part Time (16+) | 44% | 48% |
| Zero-hour contract† | 19% | 28% |
*Sources: ONS Annual Population Survey 2022; ONS Labour Force Survey 2023
^ Survey results relates to location of business worked in
†ZHC sector profile relates to UK as a whole
3.1.1 Type of business
As shown in Figure 1, workers from a wide range of hospitality businesses participated in the survey.
While the largest percentages worked for restaurants, hotels, pubs and cafés, workers from other types of business such as catering companies, takeaways and night clubs were also represented.
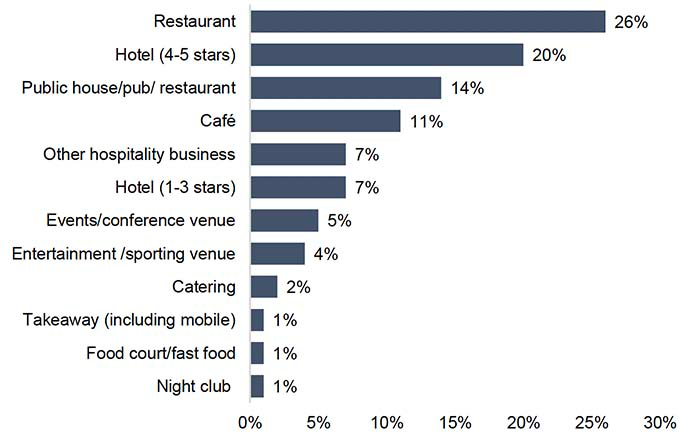
Base: All workers (n=245). Q2 Which of the following best represents the nature of the business where you work?
Comparing the worker survey sample profile with Scottish Government data on the profile of all employees working in hospitality in Scotland (Table 3), illustrates an under-representation in the survey of workers in certain types of business, most notably takeaways, while coverage of workers in other types of businesses was higher in the survey sample than in the industry as a whole, most notably hotels.
| Survey of workers sample profile | Proportion of hospitality employment* | |
|---|---|---|
| Hotels | 27% | 24% |
| Restaurants and cafés | 37% | 38% |
| Takeaways | 1% | 11% |
| Catering/ other hospitality | 18% | 10% |
| Pubs and bars | 14% | 14% |
| Licenced clubs | 1% | 2% |
Source: Business Register and Employment Survey 2022 for Employment
*Proportions calculated using rounded data.
3.1.2 Size of organisation
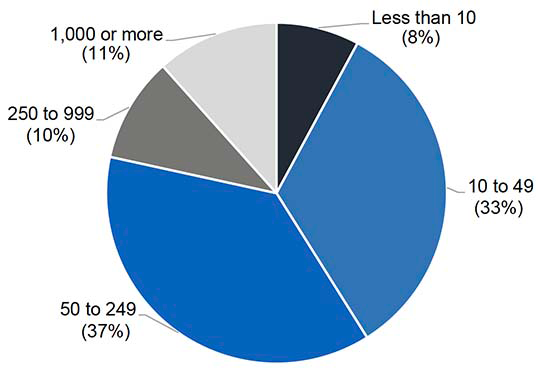
Respondents to the survey worked for a range of sizes of business. 41% worked for businesses with fewer than 50 employees, 37% for businesses with 50 to 249 employees and 21% for larger businesses with 250+ employees.
Base: All workers (n=245) Q4 Considering the whole organisation that you work for, approximately how many employees are there?
By comparison, as shown in Table 4, data on the overall workforce in the sector reports that 52% work for businesses with 0-49 staff, 13% for business with 50 to 249 staff and 35% for larger businesses with 250+ staff.
| Survey of workers sample profile | Proportion of accommodation and food services employment* | |
|---|---|---|
| 0-49 employees | 41% | 52% |
| 50-249 employees | 37% | 13% |
| 250+ employees | 21% | 35% |
Source: Businesses in Scotland, Scottish Government, 2023
*Proportions for registered private sector businesses only and calculated using rounded employment data.
3.1.3 Location of business
The survey received responses from hospitality workers from across Scotland including people working within 28 of the country’s 32 local authorities.
Reflecting the population distribution, the largest percentages worked for businesses in the central belt (27% in Glasgow and 25% in Edinburgh) but other rural and island authorities were also represented (including 6% in the Highland Council area and 2% from Argyll and Bute).
Respondents were asked to indicate which of the descriptions shown in Figure 3 best described the location of the business they worked for. While 52% worked in city centre businesses or other urban locations, a significant minority worked in rural (11%) or remote rural/ island (10%) locations.
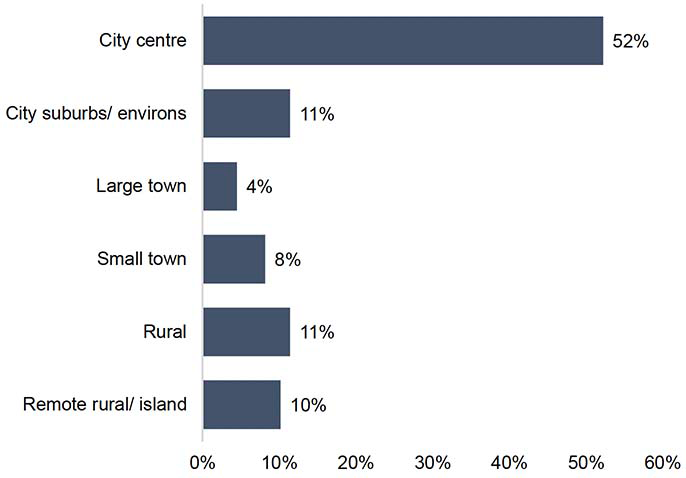
Base: All workers (n=245) Q48 Which of the following best describes where you work?
The urban-rural distribution of the businesses that respondents worked for broadly reflected the overall distribution of workers in the sector, with 76% of survey respondents in urban areas, compared with 82% across the overall sector, and 22% of survey respondents in rural areas, compared with 18% in the overall sector (Businesses in Scotland, Scottish Government, 2023. Note that proportions are for registered private sector businesses only using rounded employment data).
3.1.4 Role in the business
As shown in Figure 4, the survey was completed by workers undertaking a wide range of both front and back of house roles.
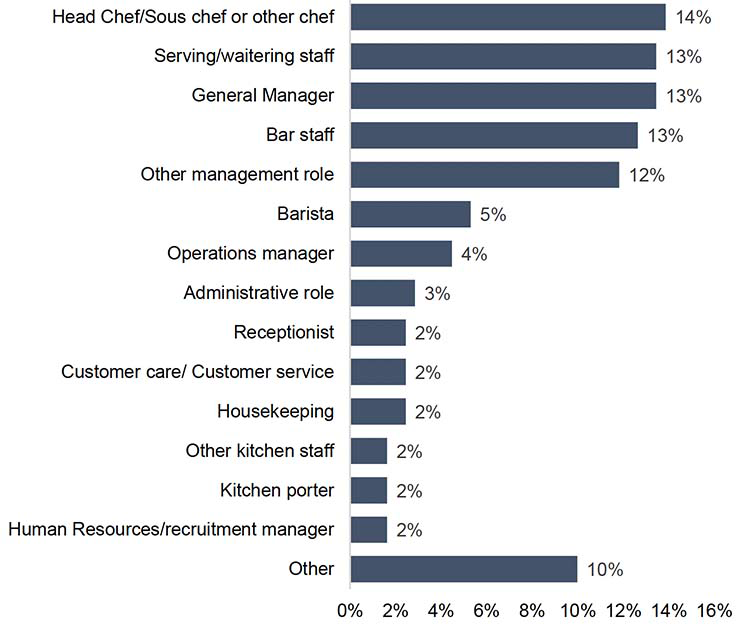
Base: All workers (n=245) Q5 Which of the following best describes your role in the business?
50% of respondents indicated that they line manage other staff. This percentage was higher for those aged 35 and over (72%) than amongst those aged 16 to 34 (36%).
3.1.5 Experience and tenure in sector
While 9% of workers taking part in the survey had worked in hospitality for less than a year and 8% had worked in the sector for 1 or 2 years, the majority had much longer experience. 19% had worked in the sector for 3 to 5 years and 63% for longer than 5 years.
The average length of experience in the sector was 8.9 years but this varied by business type from 10.6 years amongst hotel workers to 8.3 years amongst those working for restaurants and cafés and 6.6 years amongst those working in pubs and bars[1].
During their time working in the hospitality sector, workers had on average worked for five different hospitality businesses. Taking this together with the above information on total time working in the sector, suggests that the average amount of time spent working with each employer was just under two years (21 months).
When asked which of the statements shown in Figure 5 best described how they view their job in hospitality, 58% stated they saw it as their career. This was more common amongst those who worked for a hotel (72%) compared with 52% working for restaurants and cafés, and 50% for pubs and bars. Also, 77% of workers aged 35 or over provided this response, compared with just 24% aged 16 to 24, and 57% aged 25 to 34.
Overall, 25% stated that they were working in hospitality to supplement their income while studying, retired or working in another job. This response was provided by 48% of workers aged between 16 and 24, compared with 29% aged 25 to 34, and just 9% aged 35 and over.
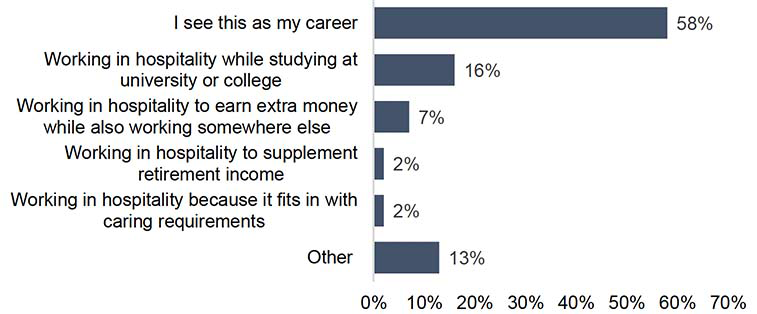
Base: All workers (n=245) Q3 Choose the option which best describes how you view your job in hospitality.
3.2 Employment and contractual status
3.2.1 Basic or contracted hours
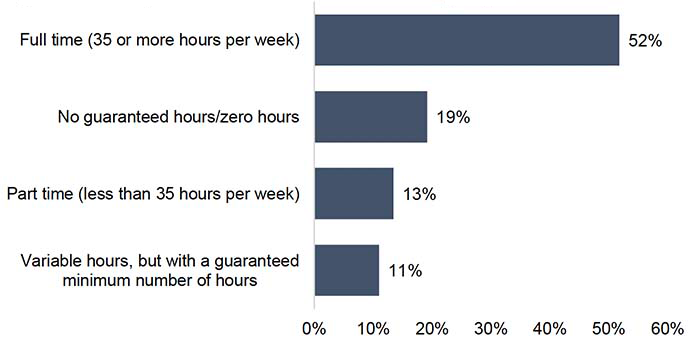
As shown in Figure 6, while 52% of workers taking part in the survey worked on a full-time basis, 13% were employed on a part-time basis and 11% had variable hours but with a minimum guaranteed number of hours.
The remaining 19% stated that their contract had no guaranteed hours/ was a zero-hour contract. 42% of those working for pubs and bars, 44% of those working in hospitality while at university or college and 38% of workers aged 16 to 24 stated that they had a zero-hour contract.
Base: All workers (n=245) Q11 What are your basic or contracted hours each week in your job at this workplace?
3.2.2 Employment situation
Asked about their current employment situation, 87% of workers stated that they were directly employed by the business they worked for while much smaller percentages had the following statuses:
- Paid through an umbrella company/ payroll company – 5%
- Paid a salary or wage by an agency – 4%
- Self-employed – 2%
Given these small percentages, the survey sample sizes for these respondents are too small to allow separate analysis amongst any of these groups.
3.2.3 Type of contract
73% of respondents reported having a permanent/open-ended contract and 13% of respondents stated that they had no written contract[2]. This was more often the case amongst staff working for a pub or bar (37%) and those working in businesses with fewer than 50 employees (23%). Analysis also compared results amongst other groups including disabled workers, member of ethnic minorities and migrant workers but there were no statistically significant differences.
3.3 Pay
Workers who were employed (i.e. excluding self-employed workers) were asked a series of questions about the pay they receive.
Base: All workers excluding those that are self-employed (n=241) Q13 Is your hourly pay at or above the Real Living Wage? Q14 If you are off sick, do you receive sick pay? Q15 Do you receive annual (holiday) leave?
3.3.1 Real Living Wage
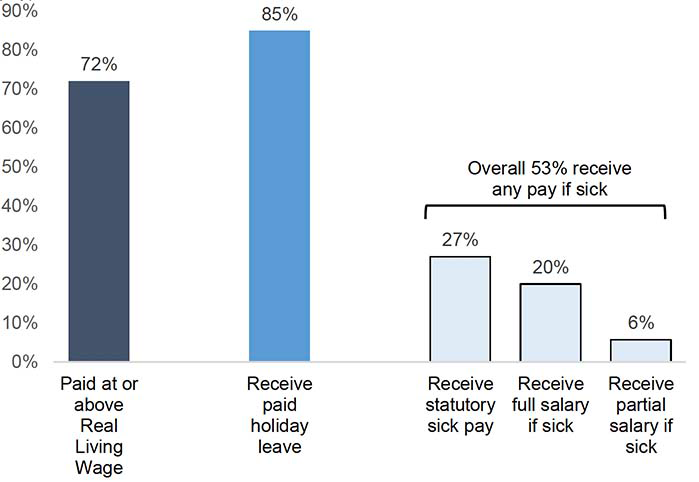
As shown in Figure 7, 72% stated that the pay they receive is at or above the Real Living Wage. Notably this is a higher level than the provisional 2023 estimate of 54% of employees in the accommodation and food services sector recorded in the Scottish Government’s 2023 Annual Survey of Hours and Earnings. This difference is likely to reflect the profile of workers taking part in the survey and how this compares with all employees in the sector, as described in Section 3.1.
Groups most likely to state that they were not paid the Real Living Wage included those working in pubs and bars (47%), those working for businesses with fewer than 50 employees (40%), women (37%) and those aged 16 to 24 (58%).
3.3.2 Holiday leave
Almost all workers are entitled to paid holiday entitlement, This includes: agency workers; workers with irregular hours; workers on zero-hours contracts (Source: Gov.UK (2023), Holiday Entitlement). However, in the survey of workers, only 84% of respondents (excluding self-employed) stated that they received paid annual (holiday) leave while 9% stated that they did not and 6% did not know if they received this.
The groups surveyed most likely not to receive holiday leave reflected those less likely to be paid the Real Living Wage, including those working for pubs and bars (21%) and those on a zero-hour contract (18%) or with no written contract (31%).
3.3.3 Sick pay
Unless they are self-employed, workers who are unable to work due to illness, are likely to be eligible for statutory sick pay after three ‘qualifying days’ (assuming they normally earn more than £123 per week on average) (Source: Acas (2023), Statutory Sick Pay).
However, only 53% of survey respondents (excluding self-employed) stated that they would receive pay if they were off sick (20% would receive full salary, 6% partial salary and 26% statutory sick pay).
A third (33%) stated they would not receive any sick pay, while 13% did not know what they would receive.
Those working for businesses with fewer than 50 employees (46% of this group) and those on a zero-hour contract or with no written contract (both 72%) were more likely to say they would not receive any sick pay.
3.3.4 Stability of pay
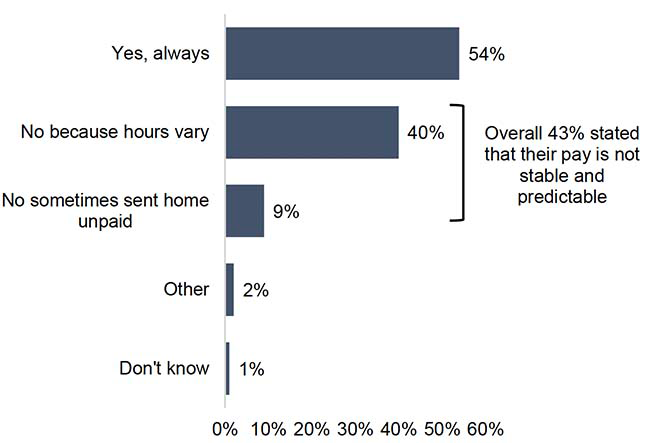
As shown in Figure 8 below, while 54% stated that their pay was always stable and predictable, 40% stated that this was not the case because their hours varied and 9% were sometimes sent home unpaid.
Base: All workers (n=245) Q16 Is your pay stable and predictable?
Overall, 43% stated that their pay was not stable and predictable. This percentage was higher amongst those working for pubs and bars (63%) but somewhat lower amongst those working for a hotel (19%).
The percentage stating that their pay was not stable and predictable was also higher amongst those working for businesses with fewer than 50 employees (57%).
Other groups more likely to state that their pay was not stable and predictable included those aged under 35 (62%), those with a disability or long-term health condition (66%) and those on a zero-hour contract (89%).
3.3.5 Tips
74% of workers in businesses where customers usually leave tips stated that they normally received a share of tips. 23% did not normally receive a share and 3% did not know.
Whether or not a share of tips was received varied most by job role, with those not receiving a share more likely to line manage staff (30% vs 16% amongst those who don’t line manage anyone) or be in general management or other management roles (36%).
Amongst those receiving tips, 78% stated that how tips were shared was clear. However, 19% stated that this was not clear and 3% did not know.
The proportion indicating that it was unclear how tips were shared was highest amongst those working in restaurants and cafés (30%).
Overall, 16% of those receiving tips stated that their employer took a deduction from their tips.
3.4 Hours
3.4.1 Overall satisfaction with hours
As shown in Figure 9 overleaf, respondents were asked to rate aspects relating to their hours at work. A wide range of responses were received with just over half stating that they were very or quite satisfied with each of the aspects rated but at least a quarter either quite or very dissatisfied.
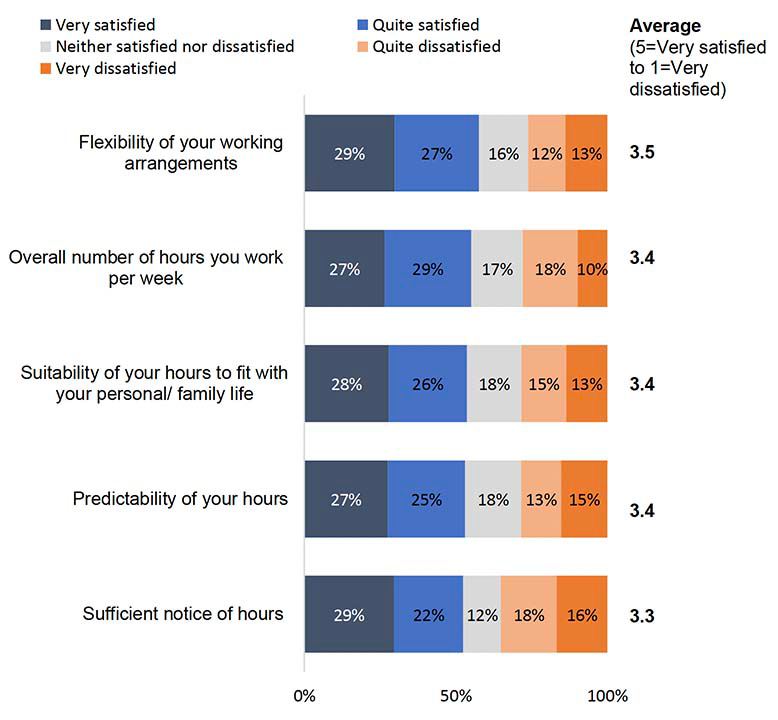
Base: All workers (n=245) Q20 Thinking about your current employment, how satisfied are you with the following aspects?
Figure 9 shows the average rating given to each area based on a maximum rating of 5 for a response of ‘very satisfied’ and minimum of 1 for ‘very dissatisfied’.
Comparing this average rating across different groups of workers illustrates some variations:
Flexibility of your working arrangements (average 3.5 overall) – highest satisfaction amongst hotel workers (3.8) and those who see hospitality as their career (3.7). Lowest satisfaction amongst those working in hospitality while studying (2.9).
Overall number of hours you work per week (average 3.4 overall) – highest satisfaction amongst hotel workers (3.9) and those who work in rural or remote rural locations (3.9) but lowest amongst those working in hospitality while studying (2.8), those aged under 35 (3.2) and those on zero-hour contracts (2.8).
Additionally, of those who stated that they were not satisfied with the number of hours they worked per week, 53% said they felt they worked too many hours while 41% felt that they did not work enough hours.
Suitability of your hours to fit with your personal/ family life (average 3.4 overall) - highest satisfaction amongst those who see hospitality as their career (3.6) and those aged 35 and over (3.8). Lowest satisfaction amongst those working in a restaurant or café (3.1), those working in hospitality while studying (3.1) and those aged 16-24 (2.8).
Predictability of your hours (average 3.4 overall) – highest satisfaction amongst hotel workers (3.8) and those who see hospitality as their career, but lowest amongst restaurant and café workers (3.0), those working in hospitality while studying (2.7) and those aged 16-24 (2.5).
Sufficient notice of hours (average 3.3 overall) – highest satisfaction amongst hotel workers (3.7), those who see hospitality as their career (3.7) and those aged 35 or over (3.7). Lowest amongst those working in restaurants and cafés (3.0), those working in hospitality while studying (2.5), those aged 16-24 (2.8) and those with a zero-hour contract (2.5).
As shown in Figure 10 overleaf, respondents were also asked to type in their suggestions on one thing which could be done to improve their working hours. While 22% stated that nothing could be done, the responses provided supported the ratings shown in Figure 9 with the most commonly provided answers relating to improving the consistency and predictability in hours (22%) and allowing breaks in their shifts (11%).
A small selection of the verbatim comments provided are also included.
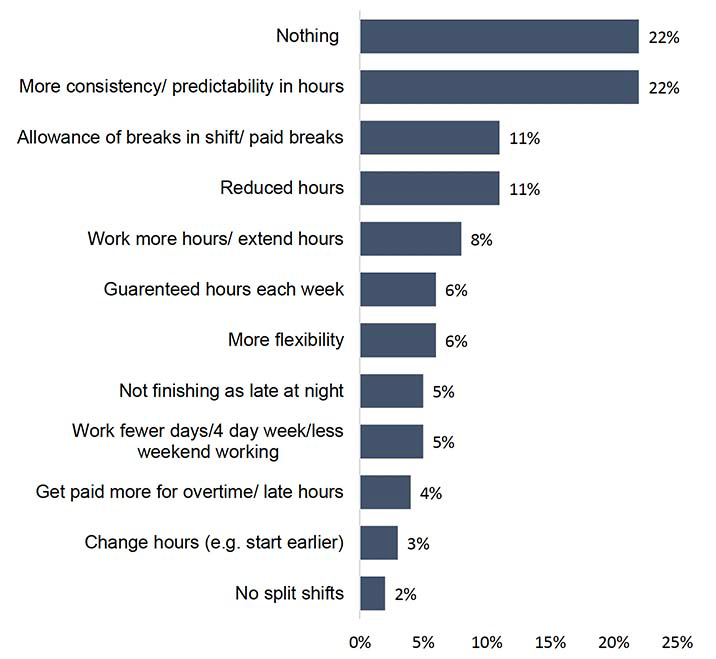
Base: All workers (n=185 providing a response) Q27 - If you could change one thing about your working hours, what would it be?
“Consistency in shift patterns and hours week to week. No more 3pm-12am then back at 7am and then no shifts for 4 days followed by the same ordeal.”[3]
“I would like a contract so that I am guaranteed a specific and agreed number of hours per week as minimum.”
“Slightly less hours would enable more time at home with young family.”
3.4.2 Working overtime
57% of workers work overtime/ above their contracted hours. This percentage was higher amongst those who see hospitality as their career (67%) and those working on a full-time basis (74%).
Those who worked any overtime were asked whether this time was paid, unpaid or a mix of paid and unpaid and for how many hours they usually worked overtime per week.
As shown in Figure 11, around 49% worked paid overtime. Groups more likely than average to work paid overtime included women (64% compared to 33% of men) and those not normally working on a full-time basis (78%).
Those who normally worked paid overtime, worked on this basis for an average of 8 hours and 22 minutes per week.
Overall, 51% either worked unpaid overtime or worked a mix of paid and unpaid overtime. A higher percentage of those who see hospitality as their career normally worked unpaid or a mix of paid and unpaid overtime (62%). The incidence of working overtime or a mix of paid and unpaid overtime was also higher amongst those who line manage staff (66%), those who work full time (65%) and men (67%).
Those who normally worked unpaid overtime, worked on this basis for an average of 8 hours and 32 minutes per week.
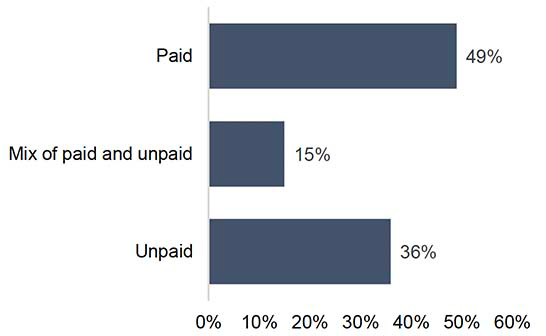
Base: Workers who work overtime/ above their contracted hours (n=140) Q23 - Is the overtime you work… Q24 - How many hours of paid overtime do you usually work per week? Q25 - How many hours of unpaid overtime do you usually work per week?
3.4.3 Breaks
As shown in Figure 12 while 46% of workers ‘always’ receive breaks, 46% receive them ‘most of the time’ or ‘sometimes’ and 7% ‘never’ receive breaks.
While never receiving breaks may be a reflection of working hours or contract type (e.g. with no requirement for breaks), 46% of workers reporting variable or inconsistent access to breaks suggests that there may be issues for workers in accessing their basic employment or contractual rights.
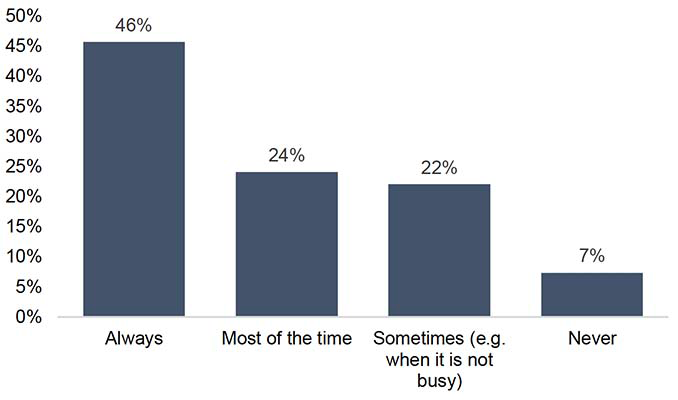
Base: All workers (n=245) Q26 - Do you receive breaks?
3.5 Training and development
3.5.1 Training received
Mandatory training is training which is essential and which ensures all staff are adequately trained on safe working practices. As such, everyone in an organisation should have received appropriate health and safety training which should be refreshed regularly.
However, just 67% of hospitality workers taking part in the survey had received health and safety training during the last 12 months. This was highest in hotels (85%) and lowest in pubs and bars (45%).
58% of hospitality workers taking part in the survey had received any other type of training either paid for or organised by their employer.
3.5.2 Satisfaction with training received
65% of hospitality workers taking part in the survey agreed that they had received enough training to be able to do their job well, but 30% did not think that they had received enough training (the remaining 5% did not know).
3.5.3 When training is delivered
As shown in Figure 13, while 51% of hospitality workers stated that they had received training during paid work time, 31% had been required to attend training in personal time. To meet fair work standards, training should be undertaken in paid for work time.
The delivery of training in personal time was most often reported by respondents working for cafés or restaurants (43%) and those on a zero-hour contract (44%).
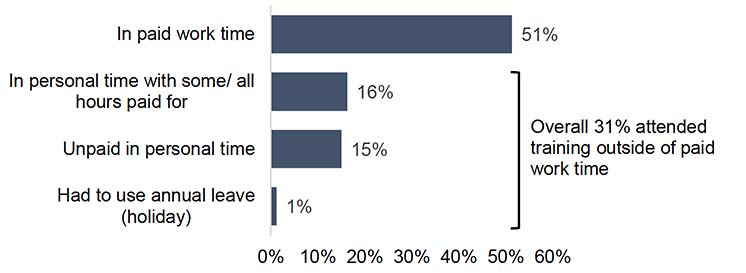
Base: All workers (n=245). Note 21% of respondents did not answer as they had not received training in the previous 12 months Q31-When was the training undertaken?
3.6 Relationships at work
3.6.1 Rating relationships
As shown in Figure 14, workers responding to the survey were asked to rate their relationships with the people they encounter at work using a 5-point scale from ‘entirely positive’ to ‘entirely negative’.
Overall, relationships with co-workers received the most positive ratings, and very little negativity, while relationships with managers were most varied across the survey sample, including 17% stating that their relationships were either mainly or entirely negative.
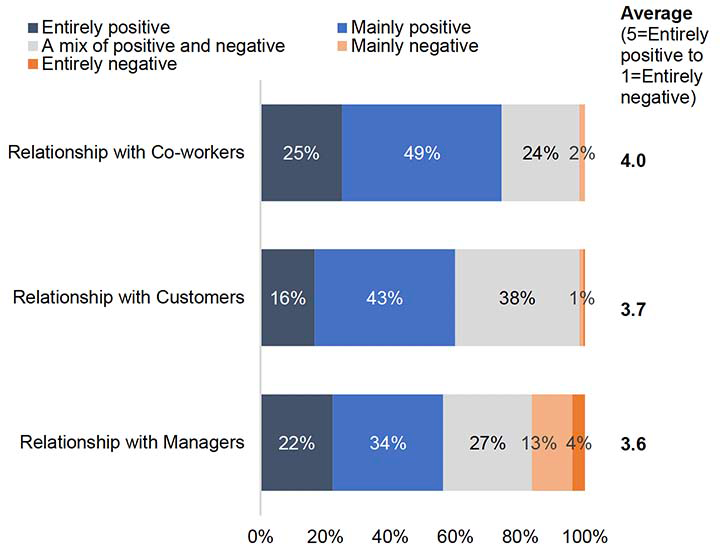
Base: All workers (n=245) Q33 In general, how would you rate the relationships you have with the people you encounter at work?
An average rating was applied to responses ranging from 5 for a response of ‘entirely positive’ to 1 for ‘entirely negative’.
Comparing this average rating across different groups of workers illustrates some variations, particularly in terms of relationships with managers which were more positive amongst those working in hotels (average 4.0) but less positive for those working in pubs and bars (3.3) and restaurants and cafés (3.4).
Relationships with managers were more positive amongst those working in hospitality as a career (3.8 vs 3.1 amongst those working while studying) and those aged 35 or over (3.9 vs 3.3 amongst those aged 16 to 34).
3.6.2 Bullying and harassment
As shown in Figure 15, 42% of workers taking part in the survey had personally experienced bullying or harassment while at work and 56% had witnessed bullying or harassment.
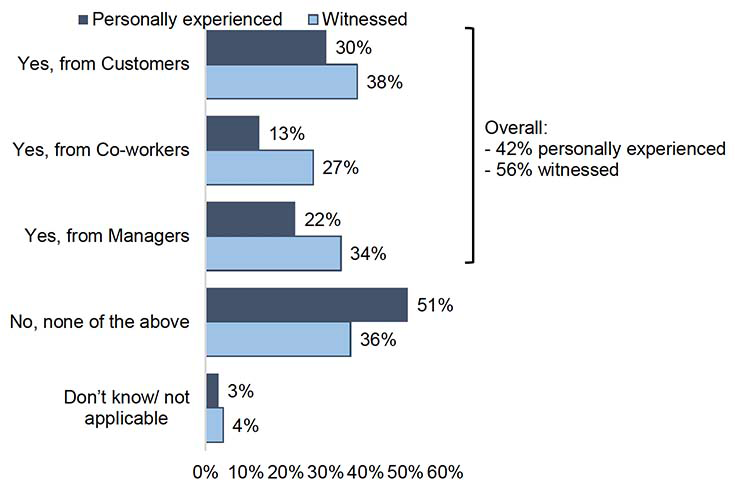
Base: All workers (n=245). Multiple responses could be provided so results total more than 100%. Q34 During the last 12 months, have you personally experienced bullying or harassment from any of the following people?
Q35 During the last 12 months, have you witnessed any of your co-workers being bullied or harassed at work?
Those in the youngest age groups were more likely than older survey respondents to have personal experiences of bullying and harassment, with 55% aged 16 to 34 reporting issues, compared with 30% of those aged 35 or over.
Respondents who had personally experienced bullying or harassment were asked if this related to any of the areas listed in Figure 16. The largest percentages stated that the issues they had experienced related to their sex, age, accent or social class. Also, 23% stated that the bullying or harassment related to factors other than those listed.
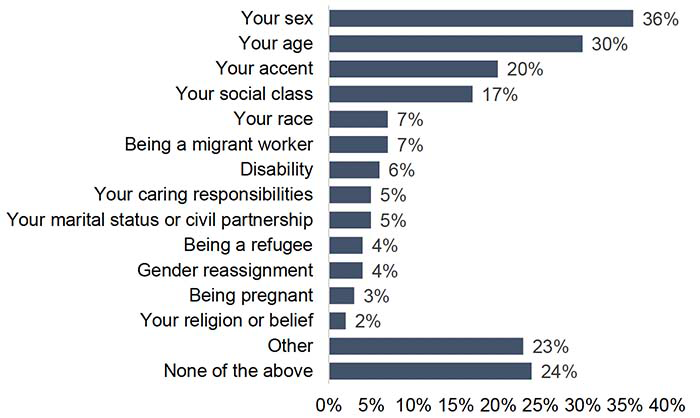
Base: Workers who had experienced bullying or harassment in the last 12 months (n=103). Multiple responses could be provided so results total more than 100%. Q36 Was any of the bullying or harassment you personally experienced from customers, co-workers or managers related to any of the following?
47% of those who had either experienced or witnessed any issues of bullying or harassment in the last 12 months had reported these issues, while 42% had not reported them (the remaining 11% did not know or preferred not to say).
The most common reasons given for not reporting the issues were:
- A lack of anyone available to report the issues to (e.g. no HR department, no one more senior than the managers the issues related to)
- An expectation that no action would be taken so there was no point reporting the issues
- A general acceptance of the issues, being ‘used to it’
- A feeling that reporting issues would lead to dismissal or make working relationships worse
- A preference to deal with the issues personally rather than reporting them
A selection of the reasons provided for not reporting issues, in the words of respondents, are provided below.
“Because I will be fired or ignored.”
“Fear of being bullied further or losing hours.”
“I didn’t feel like anything could be done about it - it would just make my work life more difficult.”
“Report to who? The bullying came from management. No HR department.”
“Our workplace has no HR department and our managers are either not present in the workplace or don’t care enough to do anything, and oftentimes would blame us.”
Amongst those who did report the bullying and harassment they had experienced or witnessed, 30% stated that the issue had been dealt with effectively, 36% that it was dealt with, but not effectively, and 25% stated that it was not dealt with at all (the remaining 9% did not know or stated that they would prefer not to say).
3.7 Employee voice
3.7.1 Opportunities to influence decisions
Overall, 62% of hospitality workers taking part in the survey have a channel through which they can have their voice and opinion listened to at work. However, 29% stated that this was not the case, while the remaining 9% either did not know or preferred not to say.
Only 43% of hospitality workers agreed that they felt that their voice and the collective voice of their co-workers was taken into account when decisions were made at work. This suggests that in many cases while a voice channel exists, its effectiveness feels limited to workers.
Respondents working in hotels (61%), those working full time (59%) and those who manage other staff (56%) were more likely to feel that their voice was taken into account when decisions were made.
However, just 31% of those working in restaurants and cafés, 31% of those aged under 35, and 13% of those working in hospitality while studying, felt their voice was taken into account in decisions.
3.7.2 Challenging employer about rights at work
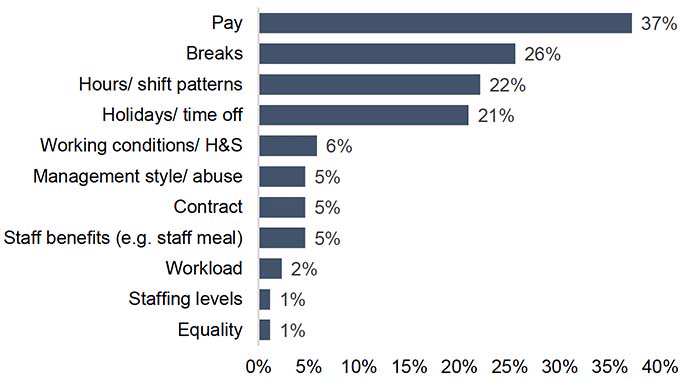
46% of hospitality workers taking part in the survey had ever had to challenge their employer about rights at work.
As shown in Figure 17, this was most commonly in relation to pay, breaks, hours or shift patterns and holidays.
Base: Workers who challenged their employer over rights at work (n=86). Multiple responses could be provided so results total more than 100%. Q43 - If you can, please give further details on the occasion(s) when you had to challenge your employer.
A selection of the responses provided when respondents were asked to give details on situations when they had to challenge their employer are provided below.
“Challenged about working a set number of hours each week when I have no contract to state how many hours I do.”
“During the pandemic, there was a massive struggle with pay and holidays. Tips are a constant issue as they are not split fairly.”
“I was hired part time due to being a single parent and full time college student but employer was putting me in full time/5 days a week, the other two days I was in college and I asked for my rota to be reduced to part time hours and he told me no that it’s not good for his business.”
“The right to breaks during long shifts and the compelling through guilt trips to stay after shift end owing to the organisation not having enough staff on shift.”
“We always receive our wages late and we have tried to ask what our official payday is but the managers refused to tell us and got angry at us for asking. We have also discovered our managers have been taking our tip money and we are about to challenge them on this.”
“As live-in I pay more rent than people with nicer rooms because of them being friends with management, tips and service charge are only paid in January and not paid if you leave before then.”[4]
The 46% of workers who had never challenged their employer about their rights at work were asked to specify why this was the case.
As shown in Figure 18, 64% stated that this was because they had always felt happy that they received everything they were entitled to, 20% were happy to put up with it and 18% did not want to challenge their employer.
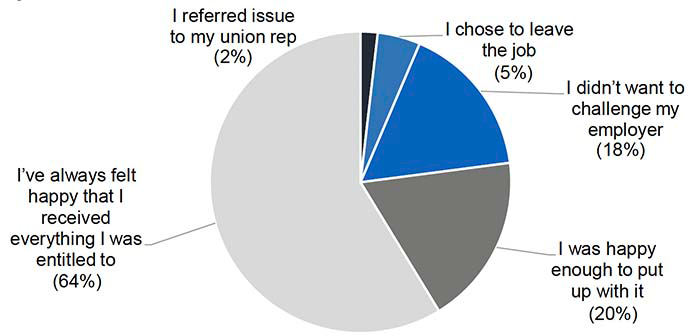
Base: Workers who have never challenged their employer over rights at work (n=112) Q44 You said that you’ve never had to challenge your employer about your rights whist working in the hospitality sector. Which of the following statements best describe why this is the case?
3.7.3 Long term illness, disabilities and health conditions
32% of hospitality workers responding to the survey stated that they
have a physical or mental health condition or illness lasting or expected to last 12 months or more indicating that they meet the Equality Act definition of having a disability. This proportion is somewhat higher than recorded amongst the overall proportion of adults in employment in Scotland who are Equality Act disabled (17%) or recorded in Scottish Government data relating to the proportion of adults employed in the Accommodation & Food Services sector who are Equality Act disabled (14%) (ONS Annual Population Survey, Jan – Dec 2022 ).
Furthermore, when shown a list of impairments and conditions, 38% selected one or more of those shown with the largest percentages indicating that they have a mental health condition (24%) and/or a learning difficulty (18%).
- Making adjustments to support work
Those respondents who indicated that they were disabled were asked to what extent, if any, their employer had made reasonable adjustments to support their work (The Equality Act 2010 requires employers to make reasonable adjustments):
- 49% indicated that they hadn’t asked their employer for any adjustments
- 15% had asked their employer and all reasonable adjustments had been made
- 18% had asked their employer and some adjustments were made, but there are more that would benefit them
- 14% had asked their employer but they refused to make adjustments
- The remaining 4% preferred not to answer.
3.7.4 Trade union membership
20% of workers responding to the survey were members of a trade union. This is considerably higher than trade union membership for employees in the accommodation and food service sector at the UK level, which is 3.2% (Labour Force Survey, Oct - Dec 2022, Department for Business and Trade).
3.8 Overall satisfaction with employment in hospitality
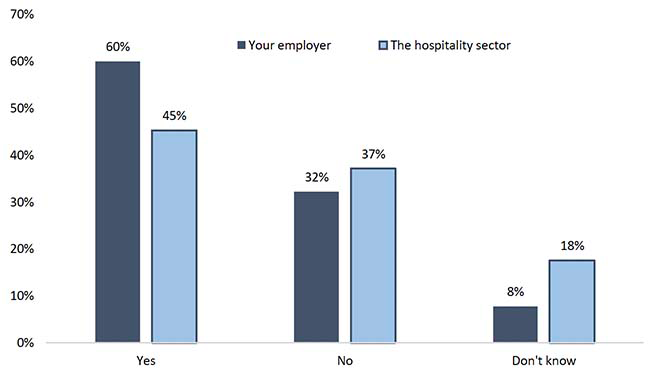
The final questions in the survey of workers asked whether, all things considered, they would recommend their employer and the wider hospitality sector as a place to work to family or friends.
As shown below, 60% would recommend their employer but only 45% would recommend the overall hospitality sector.
The proportions agreeing that they would recommend the sector varied by type of business, ranging from 58% of hotel workers to 47% of those working in pubs and bars and 34% of those working in restaurants and cafés.
Base: All workers (n=245) Q45 All things considered, would you recommend your employer to family or friends as a good place to work? Q47 All things considered, would you recommend the hospitality sector to family or friends as a good place to work?
Some of the specific comments provided by respondents were as follows:
Responses from those who would recommend their place of work
“The environment is a lovely place to be. Not had any issues with anyone that I work with and I have received the most amount of training in any job.”
“’I consider myself lucky working for my employer as care, support, trainings, meetings and well-being are regularly checked from above to all team members. Difficult to find these days.”
“Good work-life balance considering hospitality industry. Good pay, especially for low- skilled employees.”
“Very personal relationship with owners, they’ve gone out of their way in their personal lives to accommodate me during medical emergencies.”
“Large organisation with trade union recognition, good for the most part and when there are issues they can usually be resolved quickly and amicably.”
Responses from those who would not recommend their place of work
“Absolutely no respect for staff and no communication or training, just being abused for not doing things as expected.”
“They don’t listen to us and continue to push constant growth without supporting us. We work under our contracts and it’s just accepted. The place is always run in a skeleton team that is burning out staff.”
“I don’t like hospitality anymore and studying and working is very tough. Every place is not worth the effort to work …managers are the real problem sometimes.”
“Very unpleasant place to work. Bad atmosphere coming from management, unreliable breaks, bad pay, we don’t get a share of the tips even though were told we will, unpredictable rotas, no training but you are expected to know how everything is done from day 1, targeted harassment of a few of my co-workers and feeling powerless about it.”
“I was lied to at my interview so that I would take the job. Everything I was told was a lie. I get my rota on a Saturday night for the Monday coming. I don’t get my contracted hours. I get sent home early all the time and get shifts cancelled very last minute.”